Bay Area Real Estate Market Update


It’s officially fall market season! With school back in full swing and a fresh wave of post-Labor Day listings hitting the market, September typically rewards the prepared. Sellers get one last strong window before the holiday slowdown, while buyers finally gain fresh inventory to explore. In this issue, I’ve broken down the latest local sales stats, neighborhood updates, and market trends to help you navigate your next move with confidence.
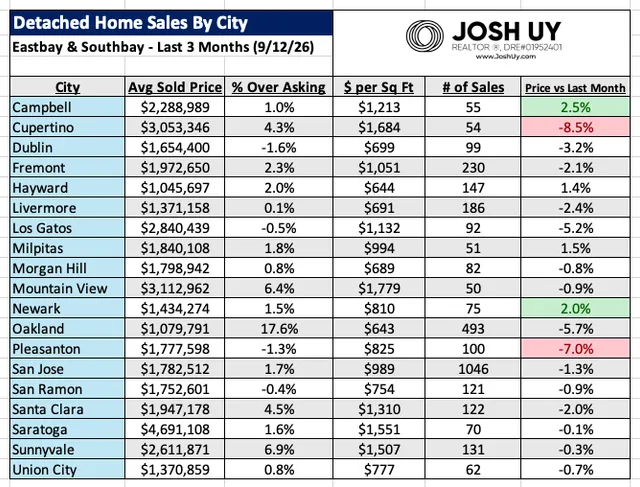
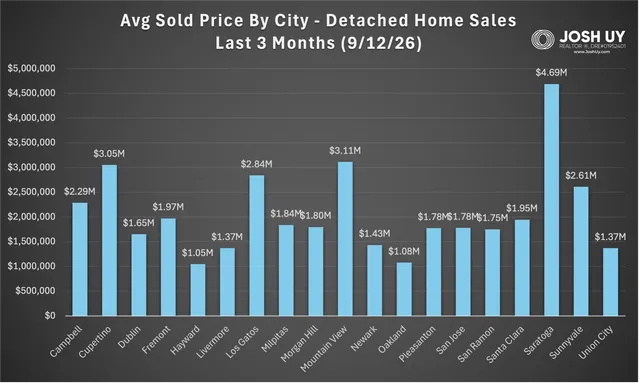
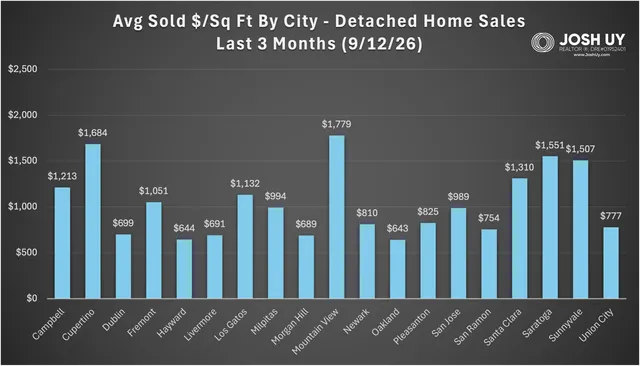
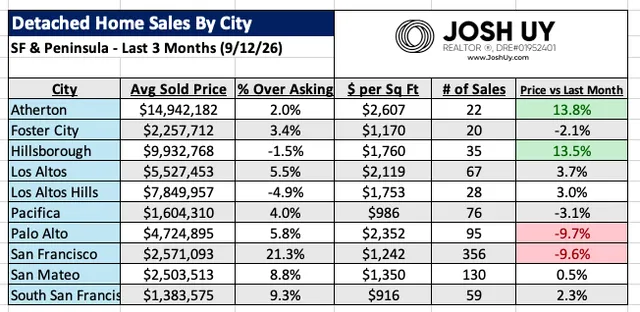
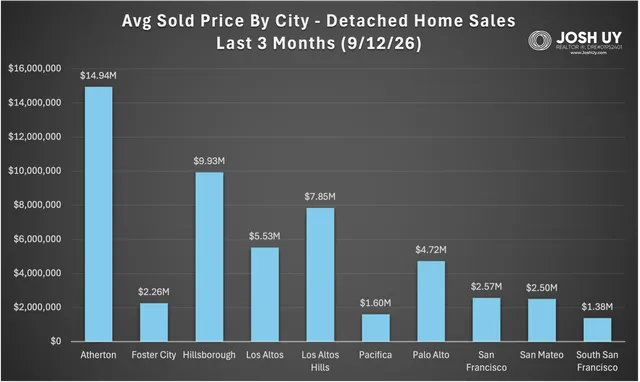
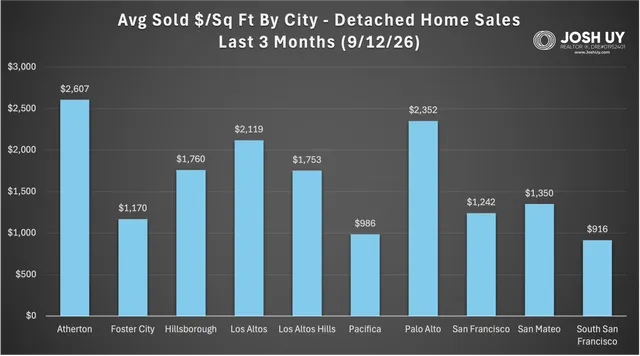
Single family home sales volumes slowed further across both regions. The 3 month rolling average for the Eastbay & Southbay group was down 8.4% to 3266 sales, while the SF & Peninsula group saw a much steeper 17.7% drop to 888 sales. The pricing story diverged by region again: Eastbay & Southbay homes eased back 1.9% to a $2.08M average (with sold $/sq ft down 1.2% to $1039/sq ft), while SF & Peninsula homes climbed 5.1% to a $5.33M average even as sold $/sq ft held essentially flat at $1625/sq ft. The big story was about percent over asking: San Francisco managed to dethrone Oakland for the top spot, jumping to 21.3% (from 17.1% last month) while Oakland took second at 17.6%. These remain the only two markets in double digits, though several others posted solid figures: South SF (9.3%), San Mateo (8.8%), Sunnyvale (6.9%), Mountain View (6.4%), Palo Alto (5.8%), Los Altos (5.5%), Santa Clara (4.5%), and Cupertino (4.3%). Over the past month, 6 of the 29 cities averaged below asking price, with Hillsborough (-1.5%) newly joining Los Altos Hills (-4.9%), Dublin (-1.6%), Pleasanton (-1.3%), Los Gatos (-0.5%), and San Ramon (-0.4%). Top movers for price compared to last month: Palo Alto -9.7%, San Francisco -9.6%, Cupertino -8.5%, and Pleasanton -7%; while the upside was led by the two estate markets, Atherton +13.8% (to a $14.94M average!) and Hillsborough +13.5%, followed by Los Altos +3.7%.
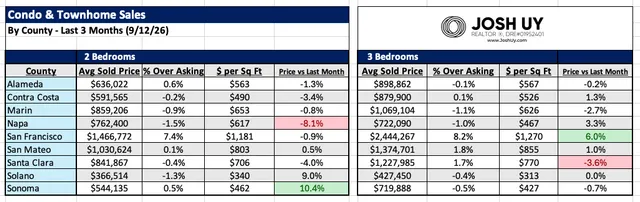
The condo & townhome market split this month following August's synchronized dip across both 2 and 3 bed segments. The 2 bedroom group dipped 0.9% to a $789K average and saw their sold $/sq ft also down 0.9% to $646/sq ft. On the other side, we had 3 bedroom units gained 1.4% to a $1.08M average as sold $/sq ft held flat at $647/sq ft. San Francisco continued to lead both segments in price and percent over asking: 2 bed units sold at 7.4% over at a $1.47M average, while 3 beds typically sold 8.2% over at a $2.44M average. It’s worth noting how steep SF's third bedroom premium has become: stepping up from 2 to 3 bedrooms adds 67% to the average price ($1.47M to $2.44M), compared to roughly 25–45% in every other county. Santa Clara was once again the volume engine on both sides (417 two bed & 315 three bed sales), while Solano remained the region's value entry point at $367K for a 2 bedroom.
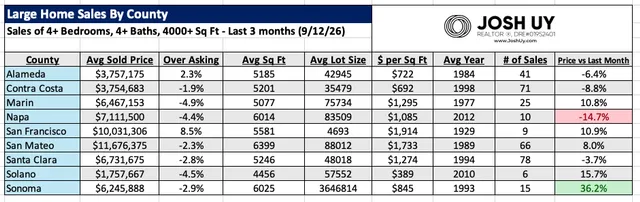
The large homes market pushed higher on thinner volume this month, seeing 12.3% fewer sales for our 3 month figure. Combined average figures for sales price and sold $ / sq ft both ticked up, with the typical home now selling for $6.39M (gain of 4.1%) at a $1105 / sq ft average (3.9% gain). Marin bounced right back from last month's decline, jumping 10.7% to a $6.47M sales price. San Mateo kept climbing, up 8% to $11.68M which extended its lead as the priciest large home county. Sonoma County had a huge boost this last month with a $38.5M sale, pushing up the average by 36.2% and vastly skewing the average lot size numbers (20x). In San Francisco, the large home count collapsed again, falling 57% to just 9 sales over the last 3 months. However, the few homes that did trade went for top dollar: average price rose 10.8% to $10.03M, sold $/sq ft jumped 13.7% to $1914, and homes somehow went 8.5% over asking. That makes SF the only county here where luxury homes are reliably sparking bidding wars!
Lastly, check out my brand new Heat Map & Companies website, designed to bring these local market metrics to life with an interactive, visual display! Feel free to reach out if you have any questions, I'd be more than happy to do a thorough / personalized analysis beyond this data. You can also check out my website for more resources & guides (www.JoshUy.com).
Talk soon,
Josh Uy
For more information on how these trends might affect your home values and/or the timing of your real estate moves, please reach out anytime. Note if your city is not listed here, a personalized analysis can be created upon request. You can also visit my website (www.JoshUy.com) which has additional resources for home buyers and home sellers. This sales data was provided by the Bayeast MLS Association and collected through 9/12/26. Data deemed reliable but not guaranteed and is subject to revision.