Bay Area Market Snapshot: October 2025


Cash is still king! According to a research report by Realtor.com released earlier this week, you might be surprised to know the percentage of all cash sales in California for the first half of 2025 was at 24.6%! When focusing on the “SF-Oakland-Fremont” metro area, the figure dips slightly to 23.6%, while the “SJ-Sunnyvale-Santa Clara” region was at 20.6%. Despite the higher prices in these areas, it was interesting to see these figures not drop too far compared to the statewide average.
Palo Alto and Hillsborough led the pack this month for the SF & Peninsula side, increasing by 5.1% and 4.8% compared to last month's figures. In the Eastbay & Southbay region, Mountain View was the top gainer at +3.6%, followed by Dublin at +2.8%. On the downside, both Saratoga & Morgan Hill clocked in at -4.4%, while Atherton had a massive -27.6% drop*. Note for Atherton, the data was skewed as last month's list of sales included 8 homes over a $10M price (vs only 4 this month), while 3 of those 8 were over $25M! Compared to last months figures, the combined number of sales was up 2.4% for SF & Peninsula, while the Eastbay & Southbay side was down 2.5%.
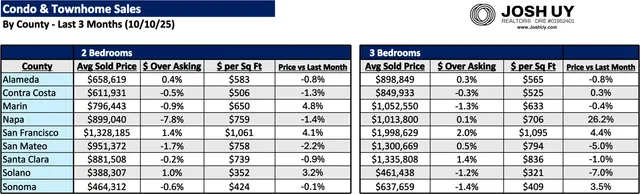
The condo & townhome market saw some small gains, increasing for both the average sales price & average sold $ / sq ft in several areas. For the 2 bedroom market, Marin County led the way at +4.8%, followed by SF at +4.1%. On the downside, San Mateo County showed up at -2.2%, and unfortunately was also one of the (loss) leaders for 3 bedrooms at -5%. Only Solano County had worse numbers, coming in at -7%. On the plus side and with the usual volatility, Napa County rocketed 26.2% higher to break back into the $1M level.
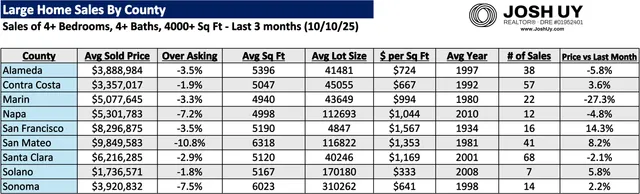
In the large homes market, SF led the way with a 14.3% gain vs last month's figure. Also having a strong month was San Mateo County, which saw its price increase by 8.2%. Note I was wondering what was going on with the -10.8% under asking figure for San Mateo County... upon further review, the data looks a bit skewed as there was a huge home in Woodside listed for $125M and eventually sold for $85M back in mid Sept. On the downside, we had Marin County fall -27.3%, dropping from nearly $7M to now $5.08M (though low sample size plus a few huge sales affected the data). Combined number of sales was relatively similar, only dipping 1.4%.
Feel free to reach out if you have any questions, I'd be more than happy to do a thorough / personalized analysis beyond this data. You can also check out my website for more resources & guides (www.joshuy.com).
Talk soon,
Josh
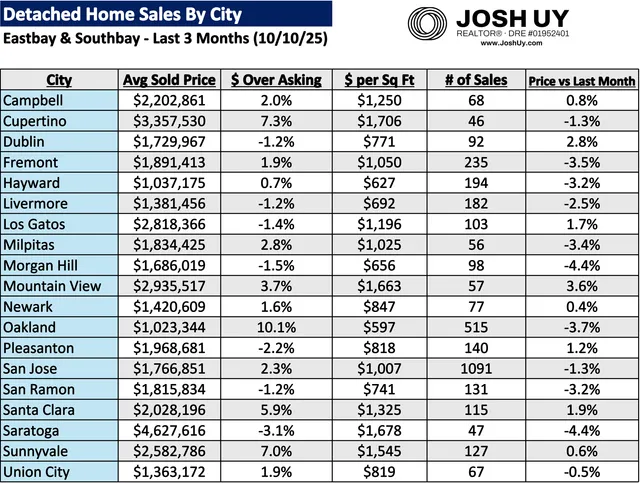
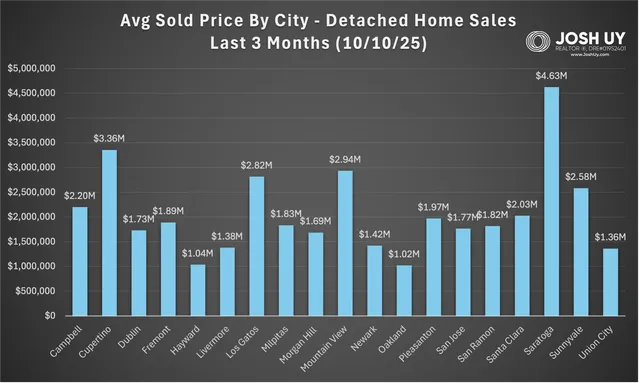
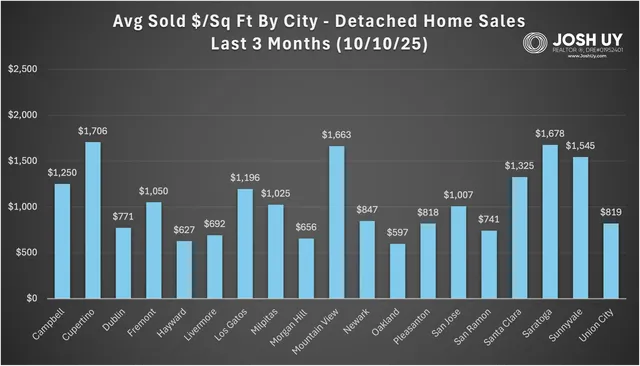
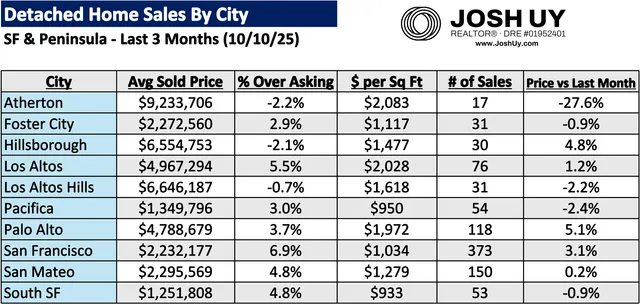
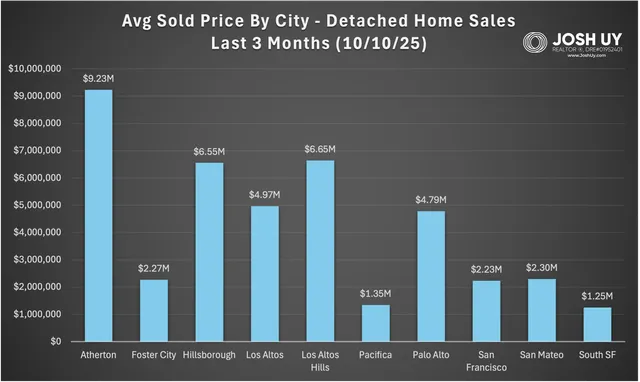
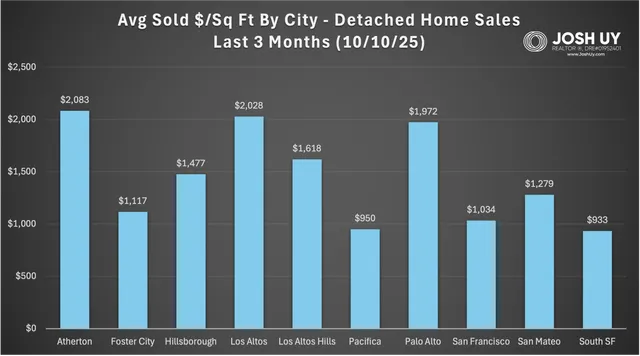
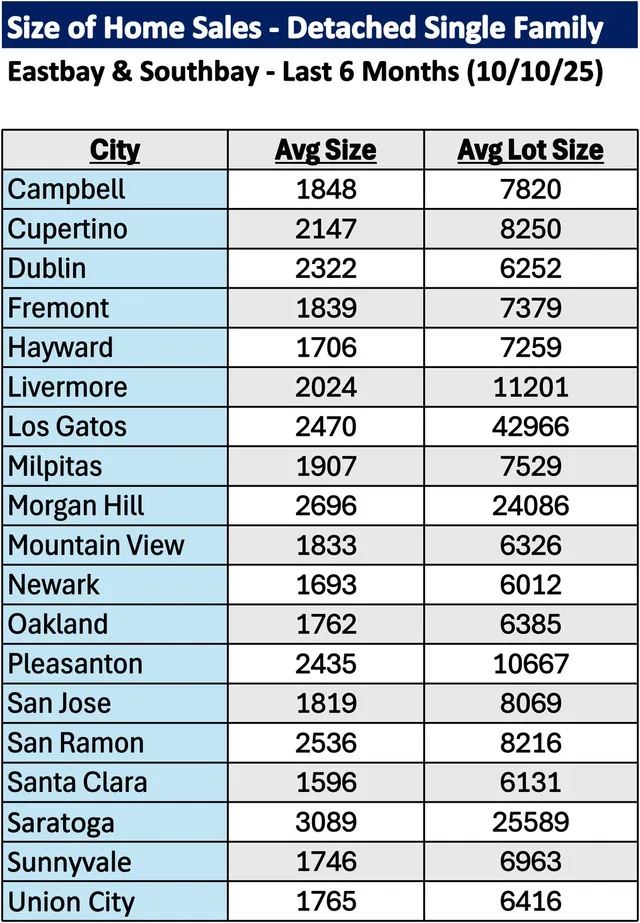
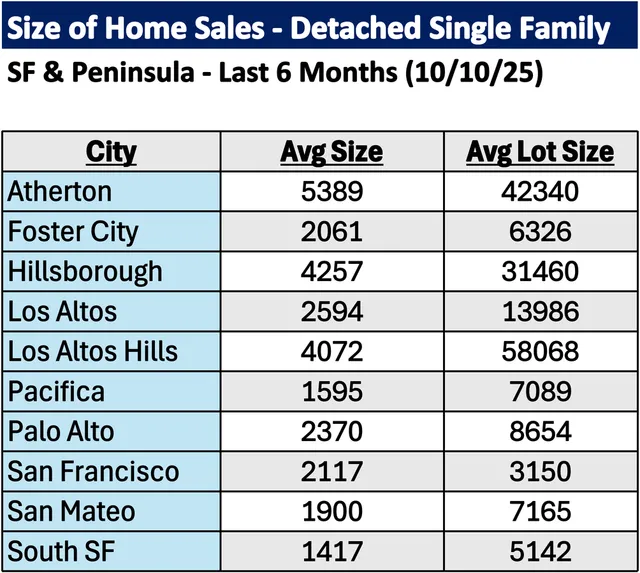
For more information on how these trends might affect your home values and/or the timing of your real estate moves, please reach out anytime. Note if your city is not listed here, a personalized analysis can be created upon request. You can also visit my website (www.JoshUy.com) which has additional resources for home buyers and home sellers. This sales data was provided by the Bayeast MLS Association and collected through 10/10/25. Data deemed reliable but not guaranteed and is subject to revision.