Bay Area Market Snapshot: March 2026


Good morning, and an early Happy St Patrick's Day to you! While we're tracking the luck (& logic) behind the latest real estate trends, we're also holding space for a bigger hope. This season, we're wishing for a different kind of fortune: a much needed de-escalation of war and a meaningful move towards peace. We're all better off when "stability" refers to the state of the world, and not just home prices or interest rates.
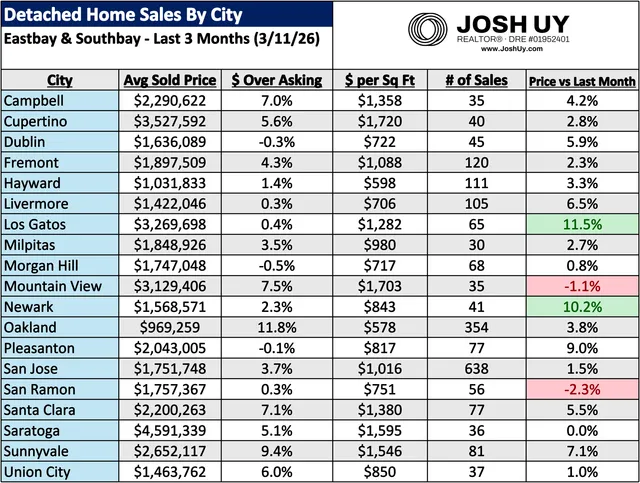
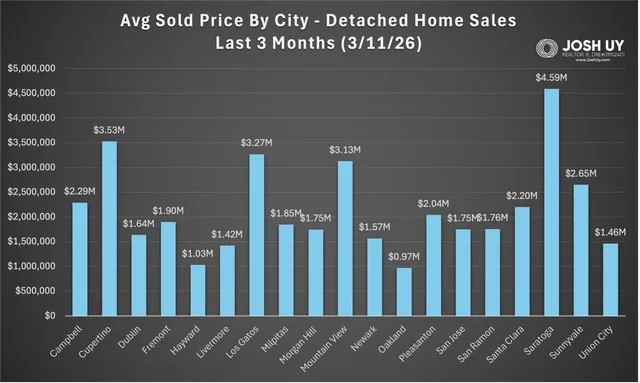
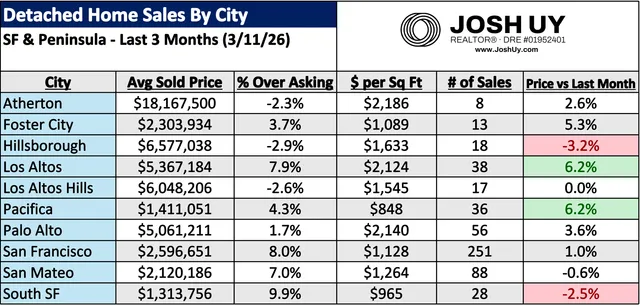
The number of sales fell again for both groups, sliding 6.4% for SF & the Peninsula group, while dipping 4.6% in the Eastbay & Southbay. However, it's worth noting that during this time last year, our 3 month rolling figure for SF & Peninsula was at 527 sales (vs 553 this year), while the Eastbay & Southbay was at 1822 (vs 2051 this year). Even as sales volume dipped for the month, average sold price recorded gains in both areas: increasing 1.8% in SF & Peninsula, while climbing 3.7% in the Eastbay & Southbay. Top movers for price include: Los Gatos +11.5%, Newark +10.2%, Los Altos & Pacifica at +6.2%, while pullbacks were seen in San Ramon -2.3%, South SF -2.5%, and Hillsborough -3.2%.
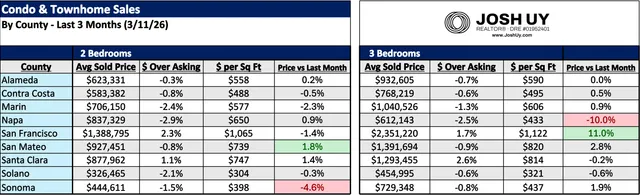
In the condo & townhome segment, the 3 bedroom market once again outperformed the 2 bedroom group last month. Price for 3 bedrooms increased 2.4%, while the sold $/sq ft rose 0.6%. The 2 bedroom market moved in the opposite direction, with both price and sold $ / sq ft dipping 0.4%. For 2 bed units, San Mateo & Santa Clara were arguably the only counties having a decent month (price +1.8%, 1.4%), while 3 beds were led by SF (+11%) and San Mateo (+2.8%).
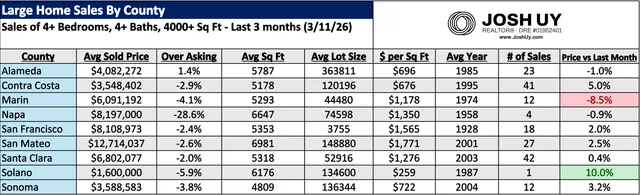
For the large homes market, the combined number of sales fell again, dipping 12.6% for our 3 month rolling period. For more context, there were 180 homes sold in the last three months, which is quite a shift from the 318 homes sold in December. Price wise, we ended the month with a modest 0.4% gain, bringing the the average "large home" sale price to $6.08M.
Feel free to reach out if you have any questions, I'd be more than happy to do a thorough / personalized analysis beyond this data. You can also check out my website for more resources & guides (www.joshuy.com).
Talk soon,
Josh
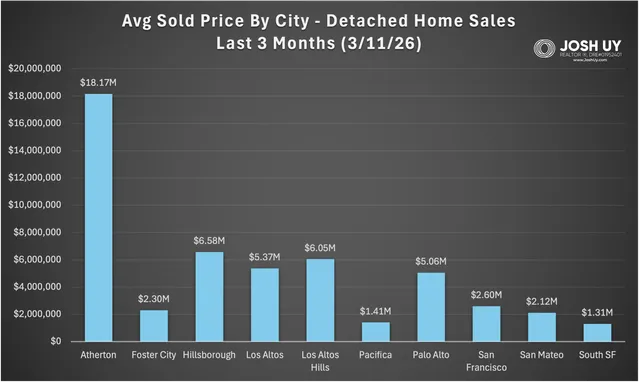
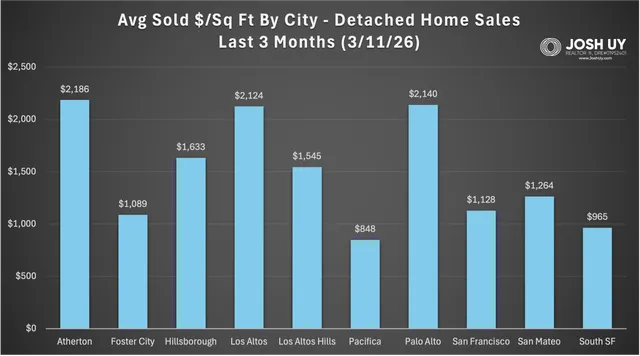
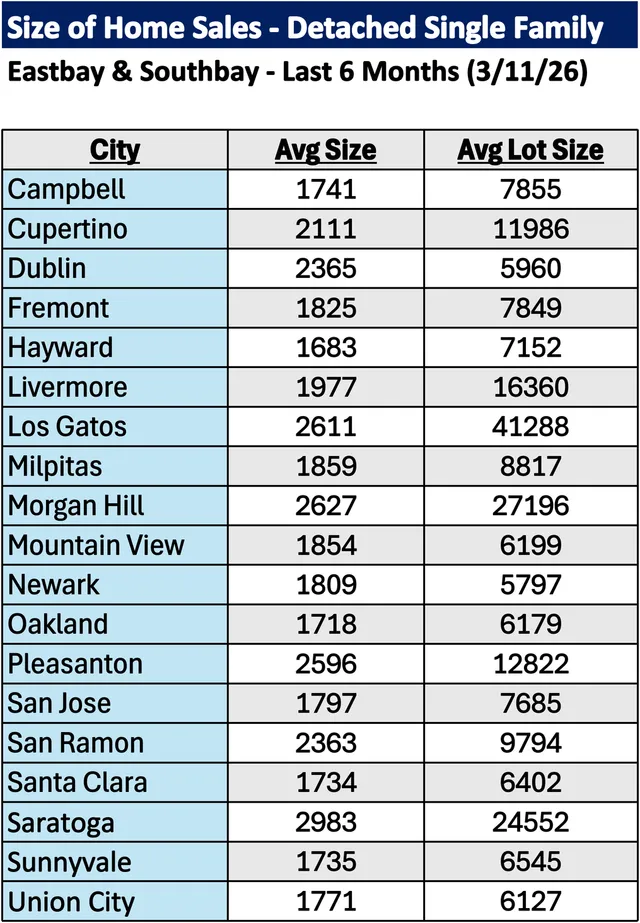
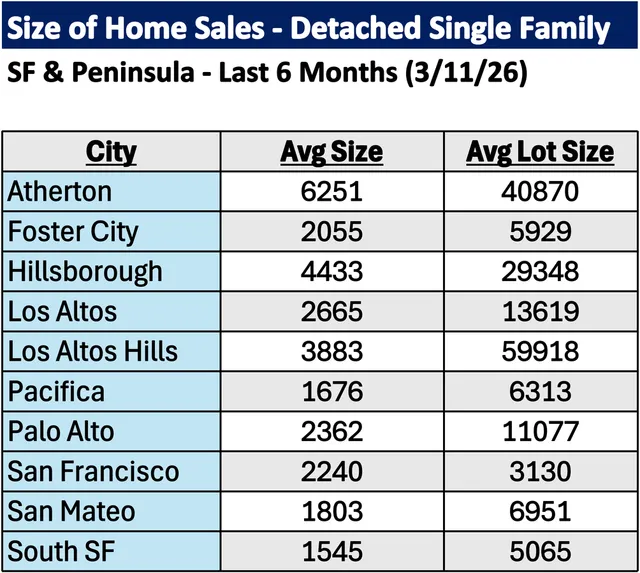
For more information on how these trends might affect your home values and/or the timing of your real estate moves, please reach out anytime. Note if your city is not listed here, a personalized analysis can be created upon request. You can also visit my website (www.JoshUy.com) which has additional resources for home buyers and home sellers. This sales data was provided by the Bayeast MLS Association and collected through 3/11/26. Data deemed reliable but not guaranteed and is subject to revision.