Bay Area Market Snapshot: July 2026


The battle for AI supremacy is moving faster than ever, with Anthropic, OpenAI, xAI, and now Meta aggressively trading blows to build the most dominant large language model. It feels like every single week a new update drops that completely shifts the tech landscape. But while these Silicon Valley giants are busy battling it out for market dominance, a parallel competition is quietly playing out right here in the Bay Area real estate market. Just like the rapid evolution of these AI models, our local housing market is moving quite fast, driven by shifting economic factors and strong buyer demand. Here is your comprehensive breakdown of the latest market trends and data shaping the local landscape this month.
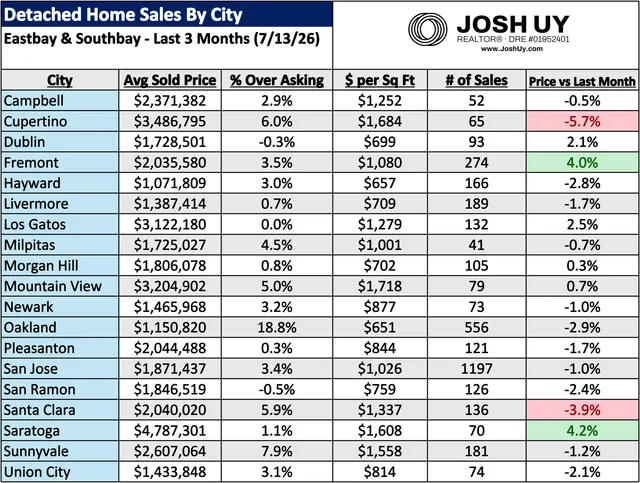
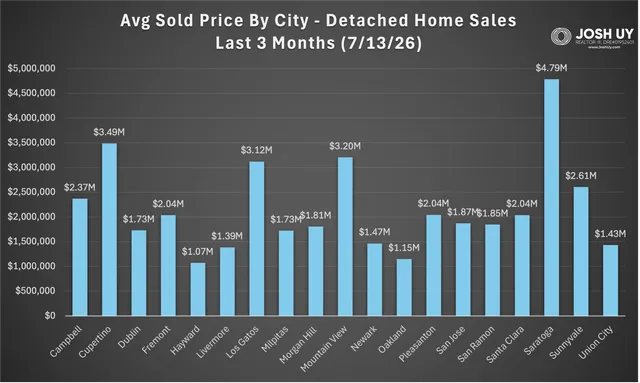
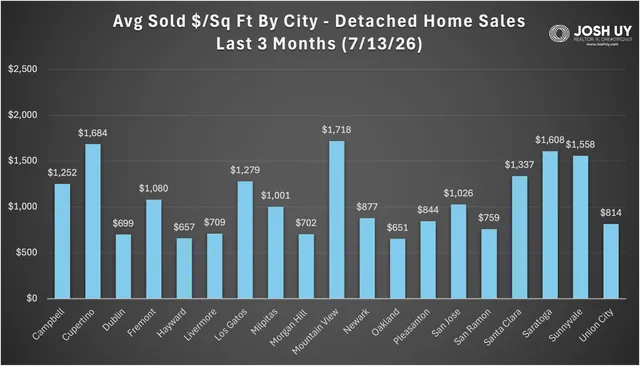
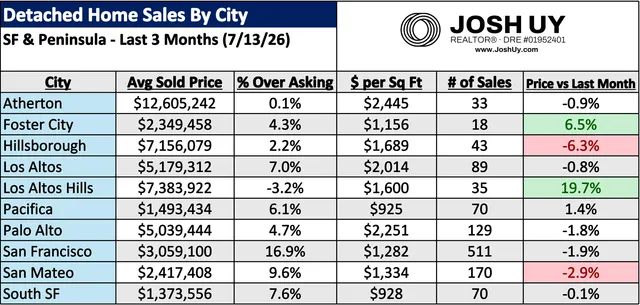
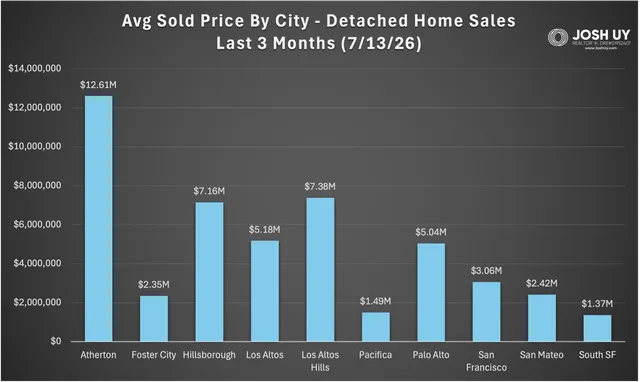
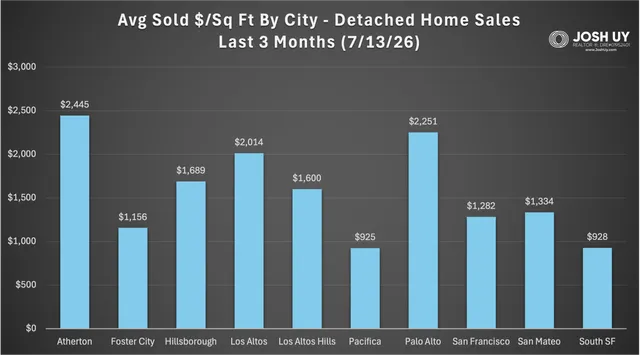
Sales volumes this month remained relatively similar to June, with the 3 month rolling average for the Eastbay & Southbay group ticking up slightly by 0.3% to 3730 sales, compared to a minor (0.9%) dip for the SF & Peninsula group to finish at 1168 sales. The story was somewhat comparable again, with prices relatively flat or experiencing a small dip. The SF & Peninsula side gained 1.1% to finish at a $4.81M average, while sold $ / sq ft dipped 0.1% to $1562 / sq ft. For Eastbay & Southbay homes, price fell 0.4% to a $2.17M average, while sold $ / sq ft decreased 1% to land at $1066 / sq ft. The usual % over asking leaders emerged once again, led by: Oakland (18.8%) and SF (16.9%) as the only ones in double figures, followed by San Mateo (9.6%), Sunnyvale (7.9%), South SF (7.6%), Los Altos (7%), Pacifica (6.1%), Cupertino (6), and Santa Clara (5.9%). Out of the 29 cities analyzed, there were only three with negative over asking averages (Los Altos Hills -3.2%, San Ramon -0.5%, and Dublin -0.3%), while others remained essentially flat (<1% change). Top movers for price vs last month: Hillsborough -6.3%, Cupertino -5.7%, Santa Clara -3.9%, and San Mateo -2.9%; while the upside was led by a massive +19.7% for Los Altos Hills (skewed by two big sales at $15M & $30M), Foster City +6.5%, Saratoga +4.2%, and Fremont +4%.
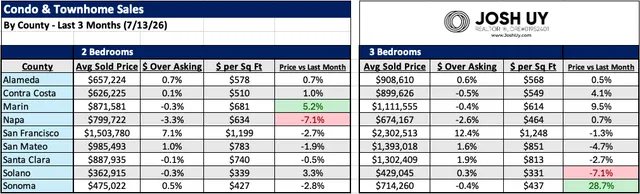
Mixed results were seen for the condos & townhomes market, with the 3 bedroom group seemingly outperforming the 2 bedroom side. For 3 bedroom sales, average price increased 1.4% to land at a $1.08M average, while sold $ / sq ft gained 0.8% to finish at $653 / sq ft. The 2 bedroom group moved the opposite way, as price dipped 1% to a $797K average, while sold $ / sq ft decreased 0.4% to finish at $655 / sq ft. SF did fairly well in both markets, selling at an average of 7.1% over for 2 bedrooms and 12.4% for 3 bedrooms, though prices were slightly down compared to last month (-2.7% for 2 beds, -1.3% for 3 beds). Biggest price movers for 2 beds include: Napa -7.1%, Solano +3.3%, and Marin +5.2%. On the 3 beds side, Solano fell -7.1%, while Marin jumped +9.5% (strong month there too), and Sonoma County with a huge +28.7% (due to a $7.8M Healdsburg sale).
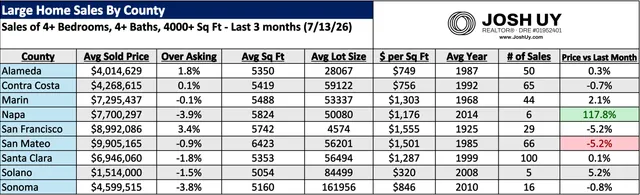
In the large homes market, average price carved out a solid +6.3% gain, with the typical home now selling for $6.14M. It was a decent month in this sector overall, with sold $ / sq ft increasing 3% to finish at $1055 / sq ft. Sales volumes also stayed higher, increasing 1.6% for our 3 month figure (381 vs 375 last month). Price action was a little mixed between the counties though: -5.2% for SF & San Mateo, but also +5.2% for Solano County, and an incredible +117.8% for Napa County (numbers inflated by two massive $13M & $18.5M sales).
Lastly, check out my brand new Heat Map & Companies website, designed to bring these local market metrics to life with an interactive, visual display! Feel free to reach out if you have any questions, I'd be more than happy to do a thorough / personalized analysis beyond this data. You can also check out my website for more resources & guides (www.joshuy.com).
Talk soon,
Josh Uy
For more information on how these trends might affect your home values and/or the timing of your real estate moves, please reach out anytime. Note if your city is not listed here, a personalized analysis can be created upon request. You can also visit my website (www.JoshUy.com) which has additional resources for home buyers and home sellers. This sales data was provided by the Bayeast MLS Association and collected through 7/13/26. Data deemed reliable but not guaranteed and is subject to revision.