Bay Area Market Snapshot: August 2026


It’s hard to believe we’re already in mid-August! Between settling back into school routines and squeezing in those last-minute moments of fun in the sun, this late summer market brings unique advantages whether you're buying or selling. The current pace offers a strategic window, giving buyers more room to negotiate while sellers get a clearer spotlight before the autumn push. In this issue, I’ve broken down the latest local stats, neighborhood updates, and market trends to help you navigate your next move.
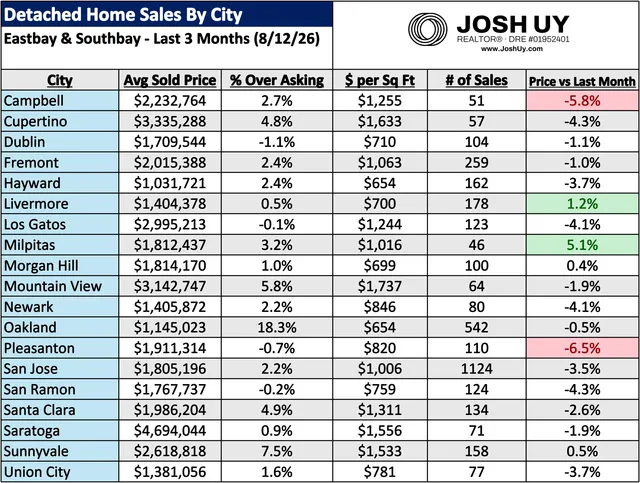
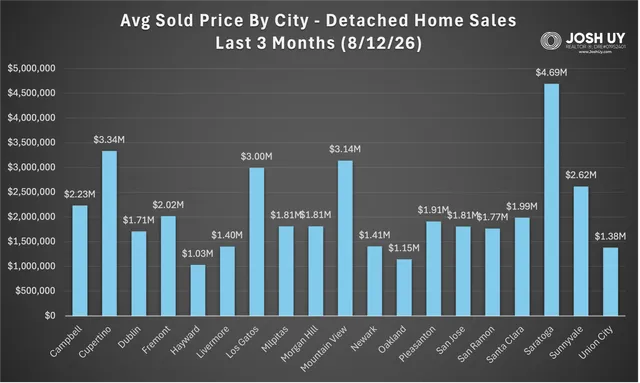
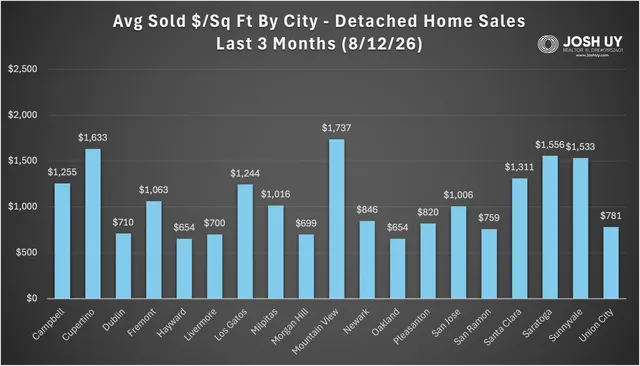
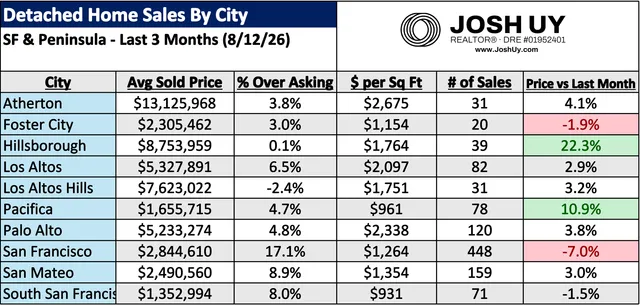
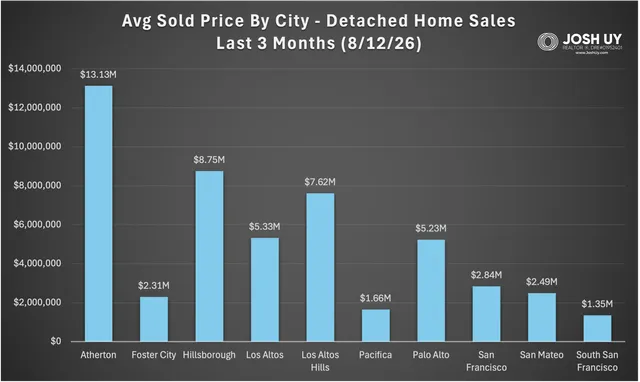
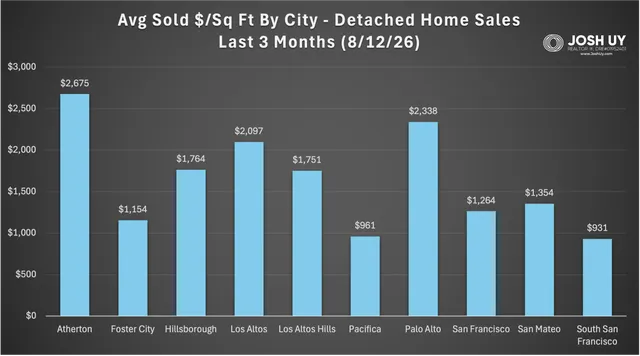
Sales volumes cooled across both regions this month, with the 3 month rolling average for the Eastbay & Southbay group slipping 4.5% to 3564 sales, while the SF & Peninsula group saw a steeper 7.6% drop to 1079 sales. The pricing story diverged by region this time: Eastbay & Southbay homes eased back 2.4% to a $2.12M average, with sold $/sq ft down 1.4% to $1051/sq ft, while SF & Peninsula homes pushed the other way, gaining 5.5% to a $5.07M average as sold $/sq ft climbed 4.3% to $1629/sq ft. The usual % over asking leaders held their ground, led by Oakland (18.3%) and SF (17.1%) as the only two in double digits, followed by San Mateo (8.9%), South SF (8%), Sunnyvale (7.5%), Los Altos (6.5%), Mountain View (5.8%), Santa Clara (4.9%), Palo Alto (4.8%), and Cupertino (4.8%). Only 5 of the 29 cities sold under asking on average, and most of those were essentially flat: Los Altos Hills (-2.4%), Dublin (-1.1%), Pleasanton (-0.7%), San Ramon (-0.2%), and Los Gatos (-0.1%). Top movers for price vs last month: San Francisco -7%, Pleasanton -6.5%, Campbell -5.8%, and Cupertino & San Ramon both -4.3%; while the upside was led by a massive +22.3% for Hillsborough (one massive $70M estate), Pacifica +10.9%, and Milpitas +5.1%.
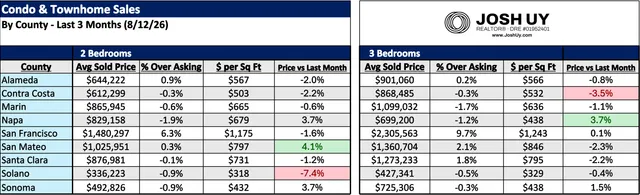
Both bedroom groups in the condos & townhomes market dipped together this month, a change from July's more mixed picture. The 3 bedroom group slipped 0.8% to a $1.07M average, with sold $/sq ft down 0.9% to $647/sq ft, while the 2 bedroom group held essentially flat, dipping just 0.1% to a $796K average as $/sq ft eased 0.4% to $652/sq ft. San Francisco continued to lead both segments on % over asking, selling at 6.3% over for 2 bedrooms and 9.7% for 3 bedrooms, though prices there were roughly flat month over month (-1.6% for 2 beds, +0.1% for 3 beds). It was a quieter month for county-level swings compared to July: on the 2 bed side, Solano fell the most at -7.4%, while San Mateo (+4.1%) and Napa & Sonoma (both +3.7%) posted the strongest gains. On the 3 bed side, Contra Costa led declines at -3.5%, while Napa (+3.7%) and Sonoma (+1.5%) were the modest bright spots.
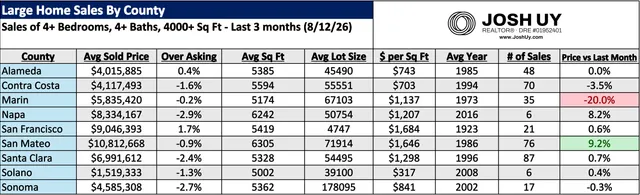
The large homes market was essentially flat overall this month after July's strong run, with the region-wide average price holding right around $6.14M (~$2500 higher vs last month) and sold $/sq ft ticking up 0.9% to $1064/sq ft. Sales volume slipped 3.9% for our 3 month figure (366 vs 381 last month). Price wise, note that flat headline masked a lot of county-level movement. Marin County pulled back sharply, down 20% to a $5.84M average as sold $/sq ft fell 12.8% and volume dropped to 35 sales from 44. On the other end, San Mateo (+9.2% to $10.81M) and Napa (+8.2% to $8.33M) posted the strongest gains. In SF the large home count fell drastically, down 27.6% to just 21 sales, while its average price ($9.05M) and sold $/sq ft ($1684, +8.3%) both ticked higher.
Lastly, check out my brand new Heat Map & Companies website, designed to bring these local market metrics to life with an interactive, visual display! Feel free to reach out if you have any questions, I'd be more than happy to do a thorough / personalized analysis beyond this data. You can also check out my website for more resources & guides (www.joshuy.com).
Talk soon,
Josh Uy
For more information on how these trends might affect your home values and/or the timing of your real estate moves, please reach out anytime. Note if your city is not listed here, a personalized analysis can be created upon request. You can also visit my website (www.JoshUy.com) which has additional resources for home buyers and home sellers. This sales data was provided by the Bayeast MLS Association and collected through 8/12/26. Data deemed reliable but not guaranteed and is subject to revision.