Bay Area Market Snapshot: January 2026


Good morning! Following the style of our mini 2025 recap from the city newsletters, here are some stats for a couple of the more interesting sales in the Bay Area over the last year.
Number of SFR sold: 37034
Highest Price: $85M
Highest $ / Sq ft: $6250
Largest Interior Size (SFR): 23900 sq ft
Smallest Interior Size (SFR): 232 sq ft
Highest 2 bed unit sale: $9M
Highest 3 bed unit sale: $24M
Largest 2 bed unit: 5009 sq ft
Largest 3 bed unit: 5700 sq ft
View these highlighted homes here.
Prices in the Eastbay & Southbay were relatively similar on average vs last month, while being slightly up for the SF & Peninsula side. However the more noticeable change was the drop off in number of homes sold (mostly a seasonal effect), as the combined number fell 18.1% for SF & Peninsula, while dropping 16.7% for the Eastbay & Southbay group. Price wise, Atherton was the top gainer last month at +11.6%, followed by Hillsborough at +8.6% for SF & Peninsula. Eastbay & Southbay were led by San Ramon at a more modest +3.9%, followed by Milpitas at +2.9%. On the down side, San Mateo led the way at -6.2% and Los Altos Hills at -4.7%, while Los Gatos posted a -5.2% and Dublin -3.8%.
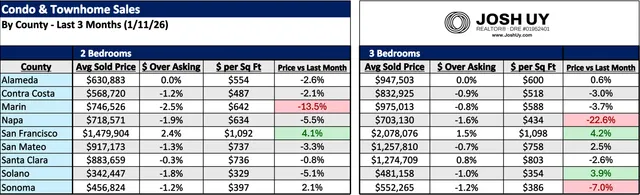
The condo & townhome market had okay numbers, seeing both the 2 and 3 bedroom markets generally soften further (combined average sale prices dipped 2.5% for 2 beds and 2.2% for 3 beds). SF was the leader for price increases for both the 2 and 3 bedroom pools, at +4.1% for 2 beds and +4.2% for 3 beds. Solano County also had stronger numbers at +3.9% for the 3 bed sales. We had some interesting action on the downside this month, but mostly due to a few larger sales leaving the data set for a couple counties: Marin for 2 beds at -13.5%, Napa for 3 beds at -22.6% and Sonoma for 3 beds at -7%.
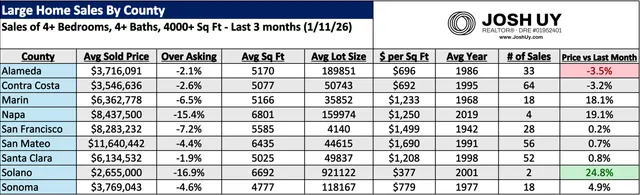
In the large homes sector, we had some bigger gains seen with: Solano County (+24.8%), Napa County (+19.1%), and Marin County (+18.1%), mainly due to smaller sample sizes and a couple large sales closing right before the end of the year. Of the 9 Bay Area Counties, 7 were positive from last month, with an average gain of 5.7%. On the down side, we had Alameda County leading the way at -3.5%, followed by Contra Costa at -3.2%. Combined number of sales fell 13.5% from last month, while average sold $ / sq ft is up 4.2%.
Feel free to reach out if you have any questions, I'd be more than happy to do a thorough / personalized analysis beyond this data. You can also check out my website for more resources & guides (www.joshuy.com).
Talk soon,
Josh
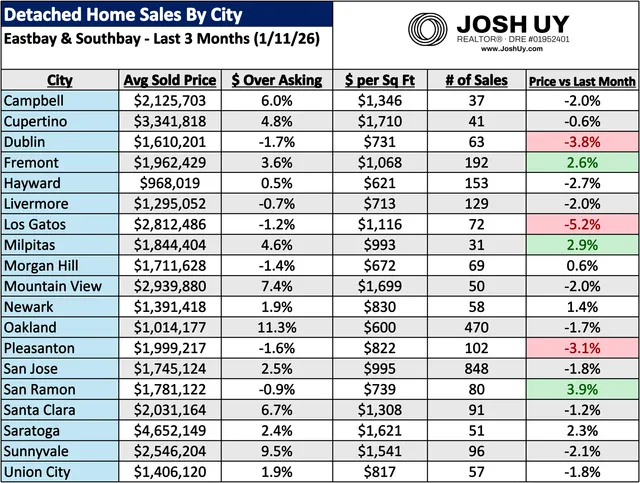
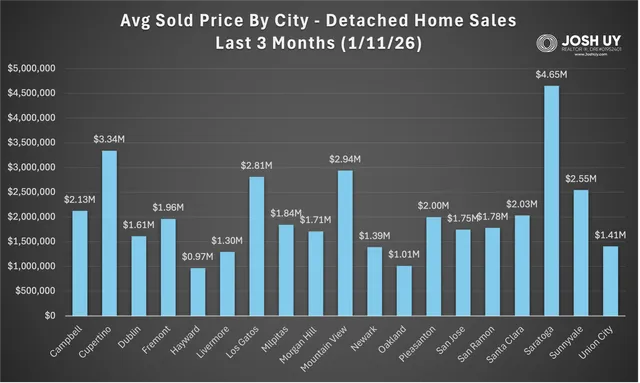
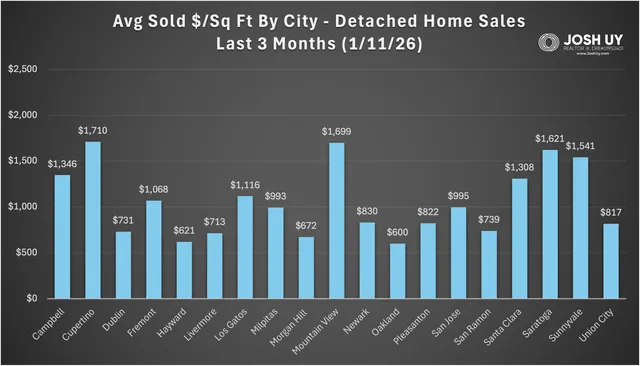
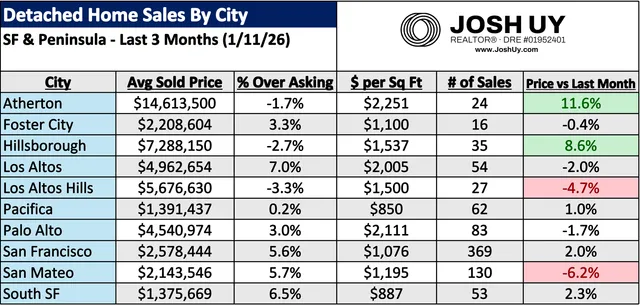
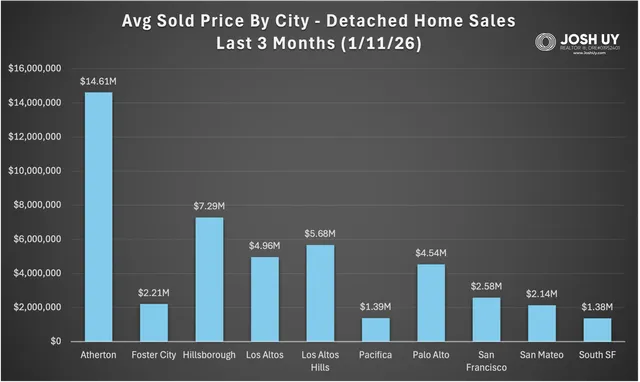
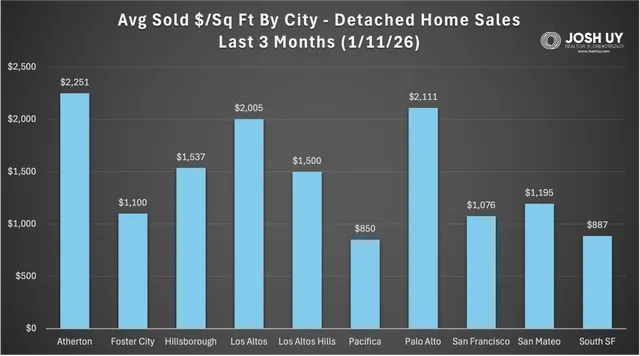
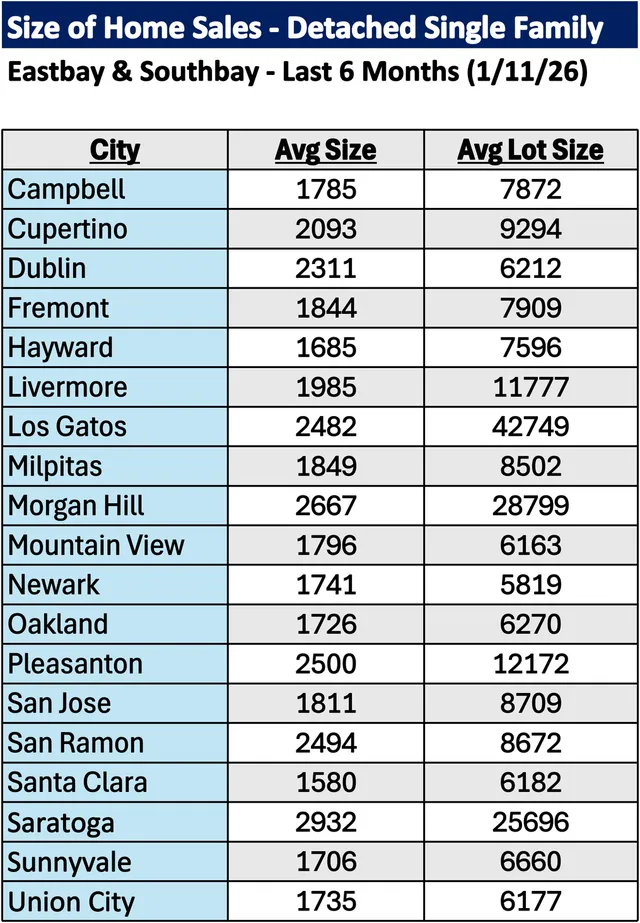
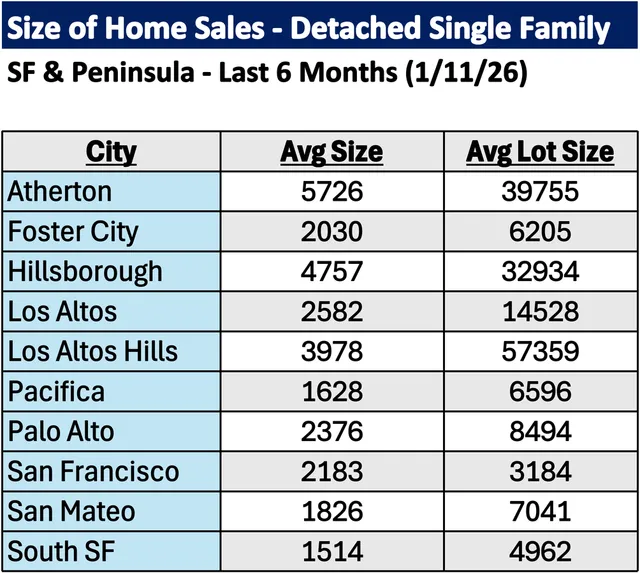
For more information on how these trends might affect your home values and/or the timing of your real estate moves, please reach out anytime. Note if your city is not listed here, a personalized analysis can be created upon request. You can also visit my website (www.JoshUy.com) which has additional resources for home buyers and home sellers. This sales data was provided by the Bayeast MLS Association and collected through 1/11/26. Data deemed reliable but not guaranteed and is subject to revision.