Bay Area Market Snapshot: September 2025


On this day in 1850, California officially joined the Union as the 31st state of the USA, fueled by the explosive population growth from the Gold Rush period. Fast forward to today, California’s “golden” legacy is still shining brighter than ever! Did you know that if our state were an independent nation, it would be the world’s 4th largest economy based on 2024 GDP figures? USA is leading the way at $29.1T, followed by China at $18.2T, Germany at $4.7T, California at $4.1T, Japan at $4T, and India at $3.9T.
As you can probably guess, a huge driver of California real estate is the dynamic Bay Area market. For detached single family homes, Los Altos Hills led the pack for the SF & Peninsula side, seeing an 4.1% increase vs last month's average sold price. Los Altos was the only other city there with a gain from last month, at +0.2%. For the Eastbay & Southbay, Hayward led the way at +3.5% and Campbell at +2.1%. On the downside, the biggest declines were Los Gatos -4.4% and Union City -5.3%, along with Palo Alto at -3.8% and SF at -8.5%. Compared to last month's figures, the combined number of sales was down 9.5% for the SF & Peninsula group, and 3.1% less for the Eastbay & Southbay side. Combined average price figures for both sides were down about 1% from last month.
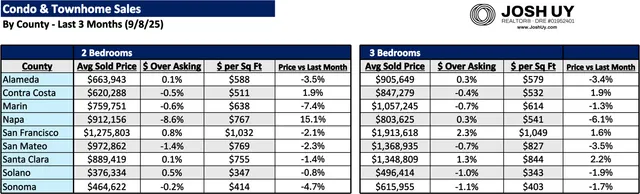
The condo & townhome market had some mixed data, for example Napa County having the highest gain for 2 bedrooms at +15.1%, but also the largest decline for 3 bedrooms at -6.1%! On the downside for 2 bedrooms, Marin County had the sharpest drop at -7.4%. For 3 bedrooms, the biggest gains were Santa Clara at +2.2% and Contra Costa at +1.9%.
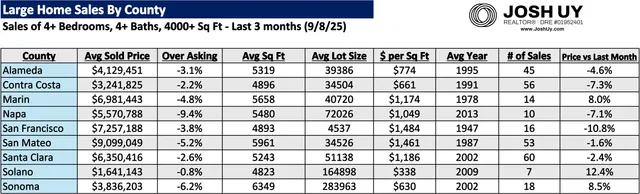
In the large homes sector, Solano County led the way yet again, posting another huge 12.4% gain vs last month's figure. Also having strong months were Sonoma County at +8.5% and Marin County at +8%. On the downside, we had SF at -10.8% and Contra Costa at -7.3%. Similar to last month, we had all 9 counties with a below asking figure, with the average at -4.2% under (was -4.5% last month). Combined number of sales was down 10% from last month (31 vs 34).
Feel free to reach out if you have any questions, I'd be more than happy to do a thorough / personalized analysis beyond this data. You can also check out my website for more resources & guides (www.joshuy.com).
Talk soon,
Josh
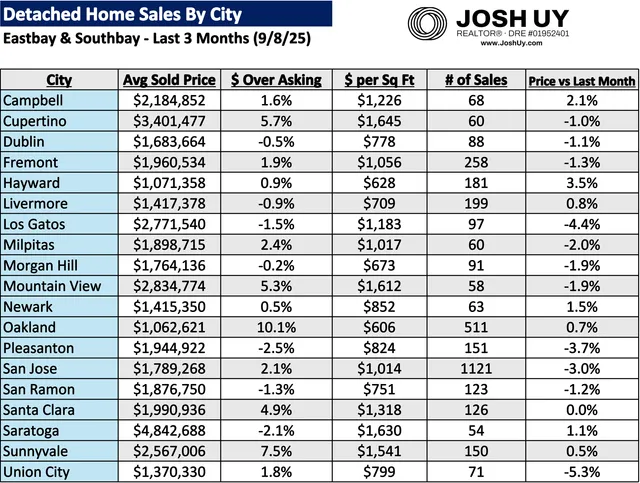
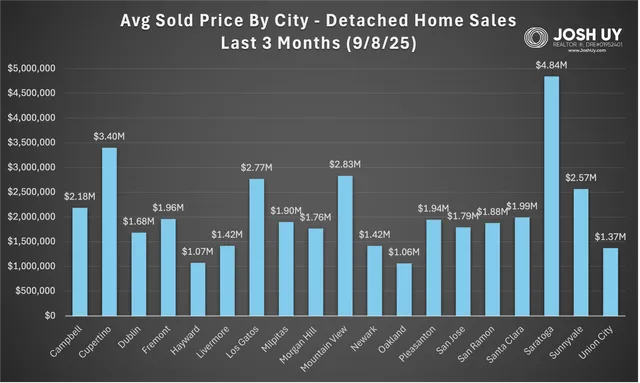
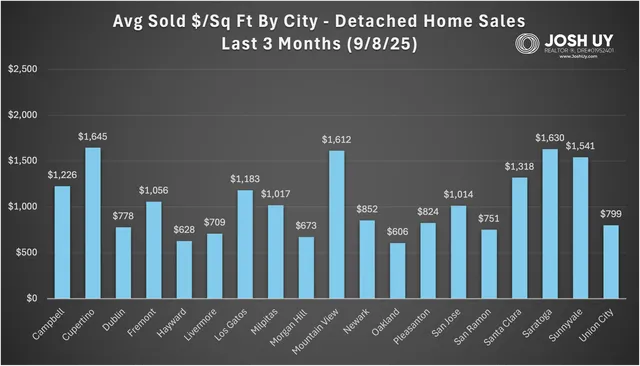
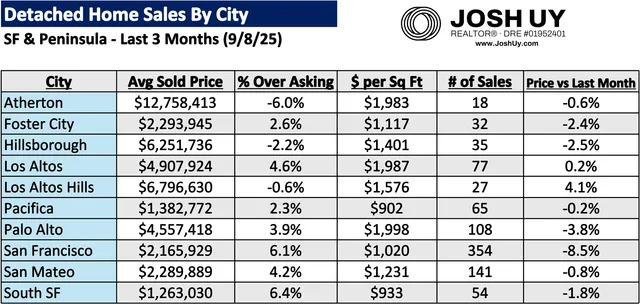
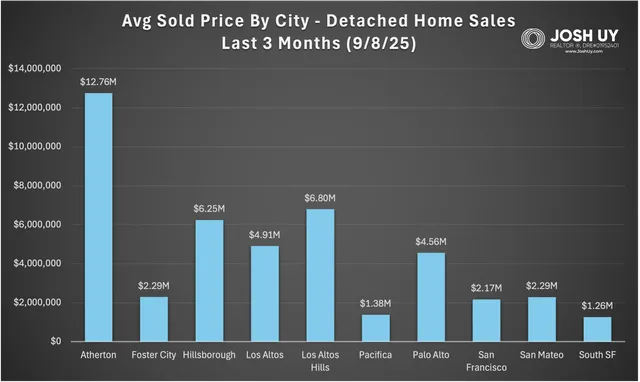
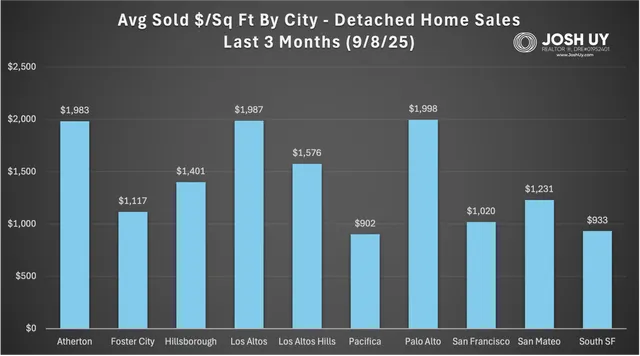
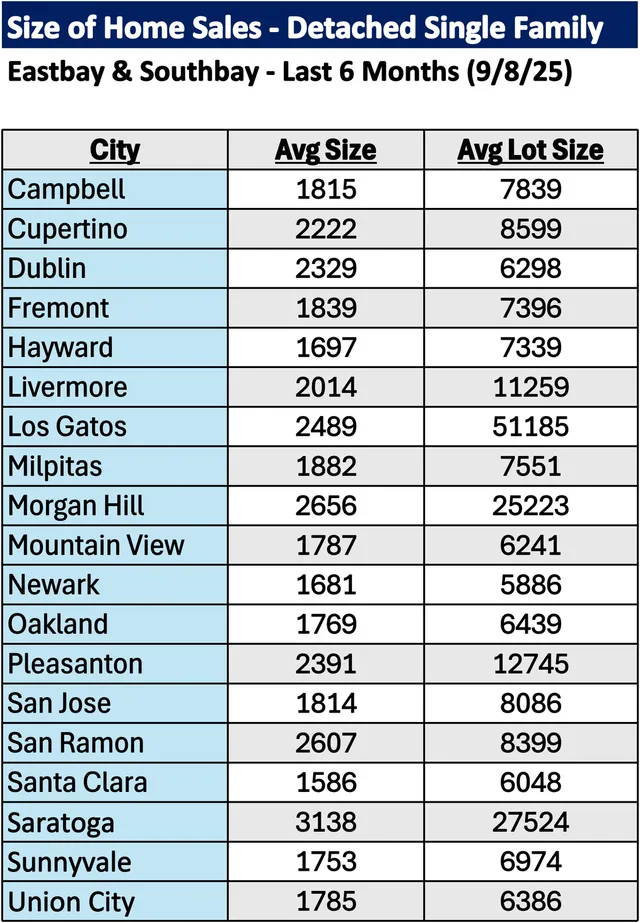
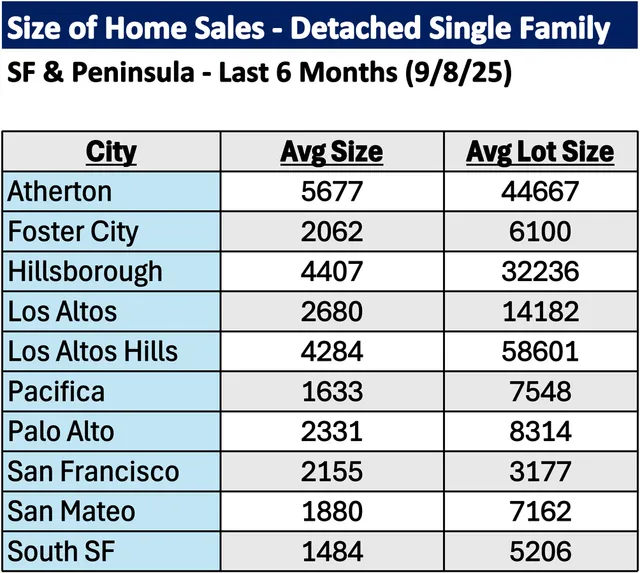
For more information on how these trends might affect your home values and/or the timing of your real estate moves, please reach out anytime. Note if your city is not listed here, a personalized analysis can be created upon request. You can also visit my website (www.JoshUy.com) which has additional resources for home buyers and home sellers. This sales data was provided by the Bayeast MLS Association and collected through 9/8/25. Data deemed reliable but not guaranteed and is subject to revision.