Bay Area Market Snapshot: June 2025


While the weather has been relatively cool for this time of year, home prices are following the trend and generally losing some steam after the spring hot season. Of course there some exceptions though, as the biggest gainers for sales price on the SF & Peninsula side were Atherton at +6.3% and Hillsborough at +2.6%, while Eastbay & Southbay were led by Mountain View with +3.9% and Milpitas with +3.2%. On the downside, the biggest decliners were South SF at -4.5% and Palo Alto at -4.1%, along with Campbell with -8.6% and Cupertino at -2.4%. Compared to last month's figures, number of sales for detached single family homes increased 18.4% in the SF & Peninsula side, while also increasing 15.5% in the Eastbay & Southbay.
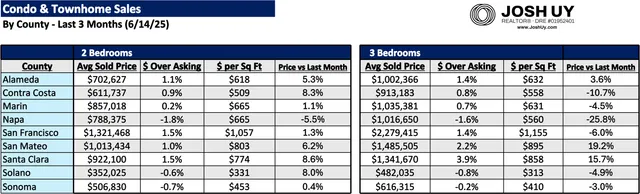
We saw also some bigger swings for condo & townhomes, as our 3 month average figures were either seeing jumps in price or bigger drops. For the 2 bedroom side, the biggest decliner was Napa County at -5.5%, while Santa Clara County had the largest increase at +8.6%. For the 3 bedroom market, Napa County also had the largest decline at -25.8%, but note it's common to see huge moves there with the typically low sample sizes. Gains wise, San Mateo County led the way with a 19.2% increase (gaining back even more than the big -12.4% drop last month).
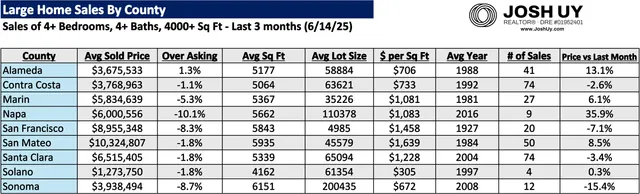
In the large homes market, San Mateo County has been booming since March, with the average sold price now selling for $10.3M (up 25.8% since then). Marin County has been doing well too, with the average home now selling for $5.83M (up 17.1% since April). The biggest gainers were Napa at almost +36% and followed by Alameda County at +13.1%. On the decliner side, SF County at -7.1% and Sonoma County at -15.4% led the way. Number of sales also increased 27.4% from last month's (3 month average) figures!
Feel free to reach out if you have any questions, I'd be more than happy to do a thorough / personalized analysis beyond this data. You can also check out my website for more resources & guides (www.joshuy.com).
Talk soon,
Josh
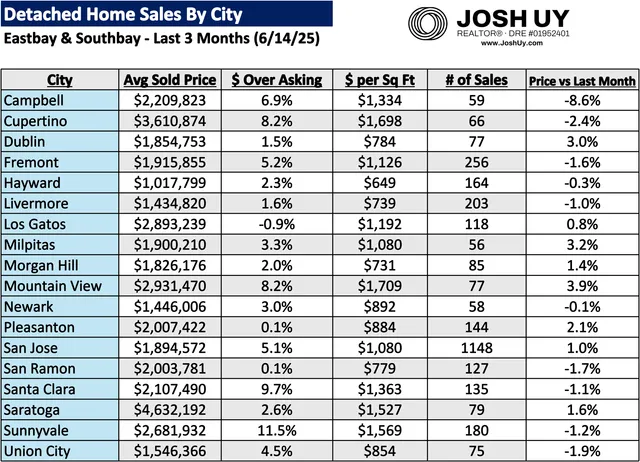
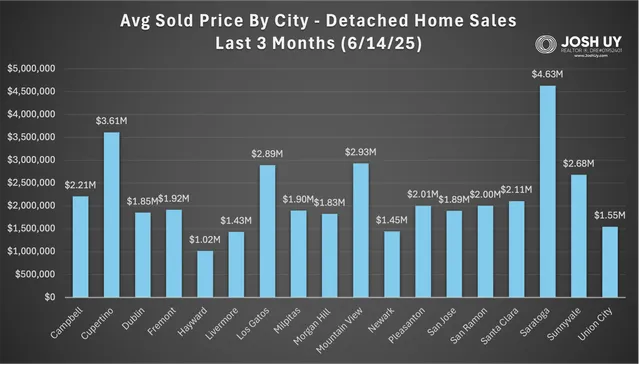
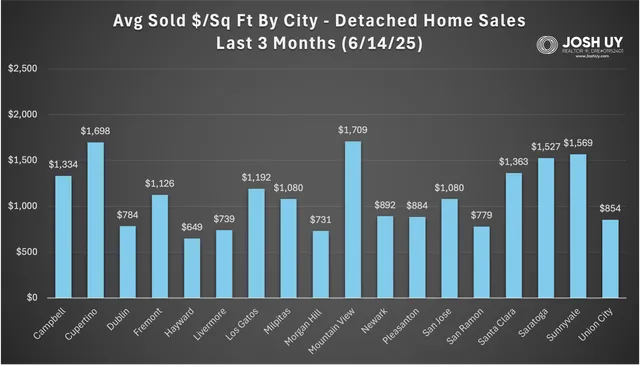
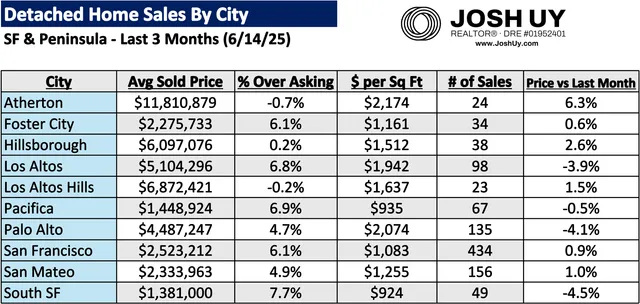
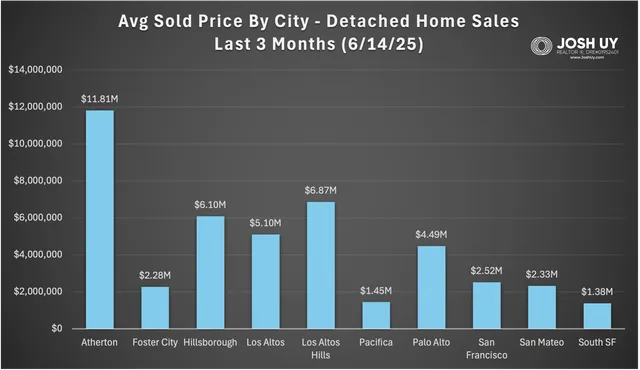
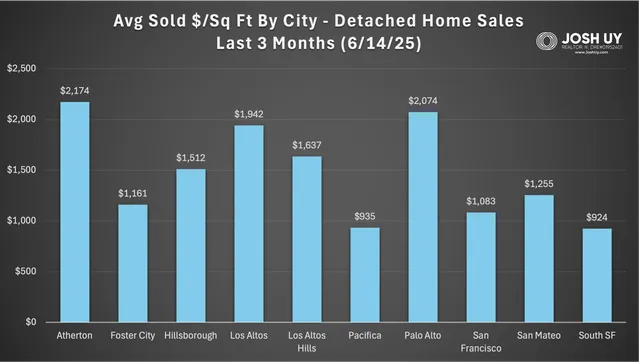
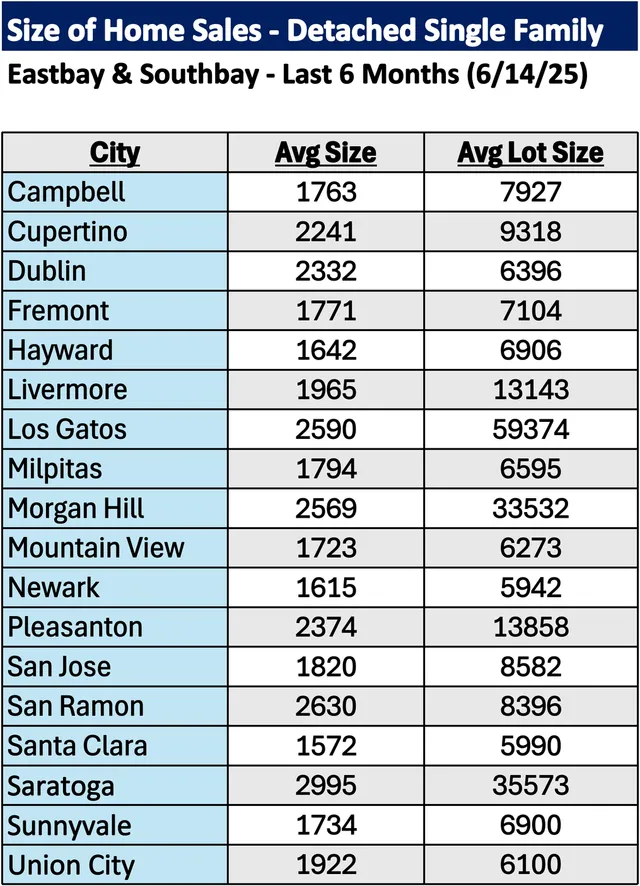
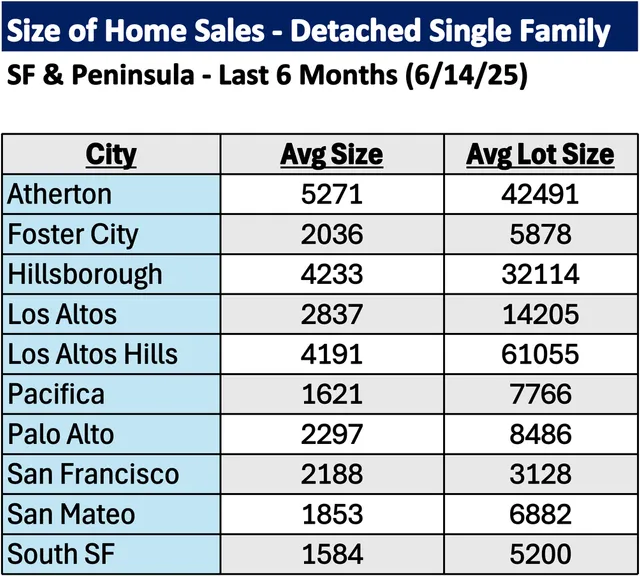
For more information on how these trends might affect your home values and/or the timing of your real estate moves, please reach out anytime. Note if your city is not listed here, a personalized analysis can be created upon request. You can also visit my website (www.JoshUy.com) which has additional resources for home buyers and home sellers. This sales data was provided by the Bayeast MLS Association and collected through 6/14/25. Data deemed reliable but not guaranteed and is subject to revision.