Josh Uy, REALTOR www.JoshUy.com

Bay Area Market Snapshot: April 2025


SF Bay Area Market Snapshot title banner over the Golden Gate Bridge at dusk
Everhome Real Estate logo. Easter version with a decorated Easter egg

Did you know April takes its name from the Latin word aperio, which means "to open" or "bud"? Much like the blooming landscape during this period, the real estate market is showing signs of fresh opportunities this season. Whether you’re looking to plant roots in a new home or cultivate your investment portfolio, this month's newsletter can give you glimpse of the current Bay Area landscape.

Feel free to reach out if you have any questions or would like to chat more. I'd be more than happy to do a thorough / personalized analysis beyond this data. You can also check out my website for more resources & guides (www.joshuy.com).

Take care,

Josh
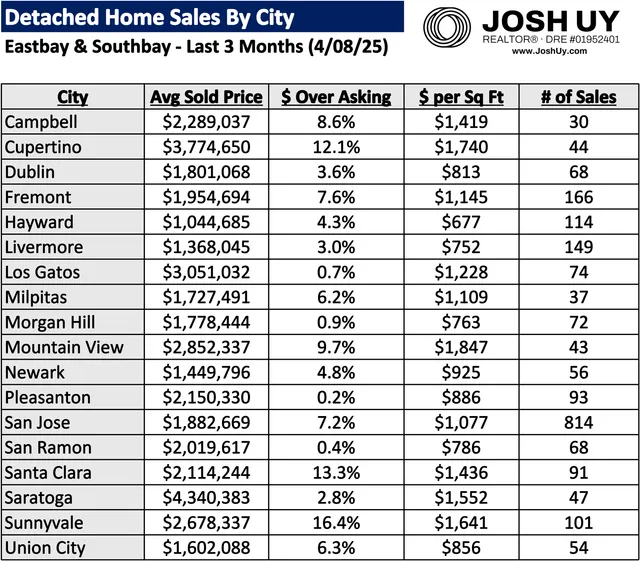
Table of detached single-family home sales by city in the East Bay and South Bay over the last 3 months: average sold price, percent over asking, price per square foot, and number of sales
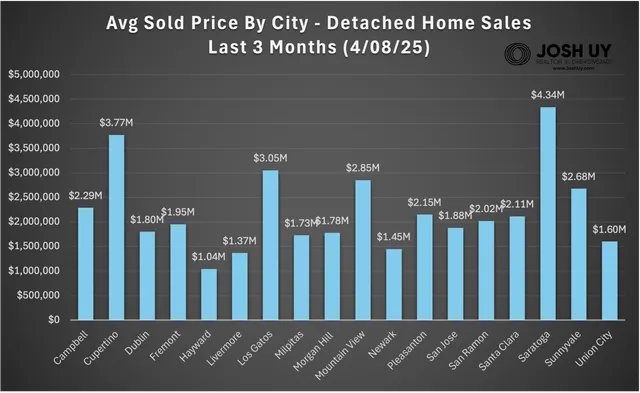
Bar chart of the average sold price of detached homes by city in the East Bay and South Bay over the last 3 months
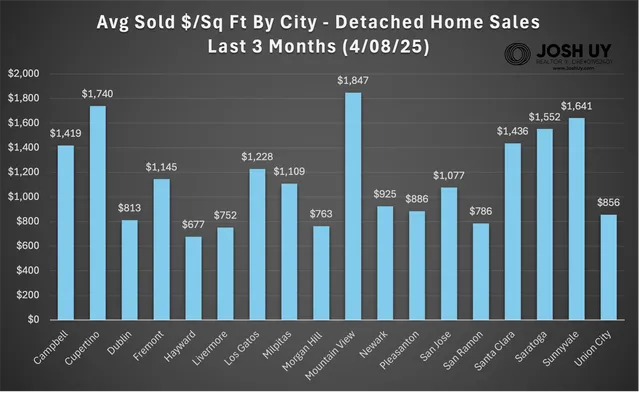
Bar chart of the average sold price per square foot of detached homes by city in the East Bay and South Bay over the last 3 months
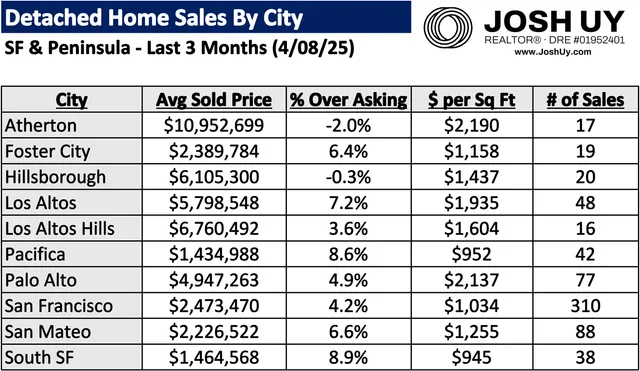
Table of detached single-family home sales by city in San Francisco and the Peninsula over the last 3 months: average sold price, percent over asking, price per square foot, and number of sales
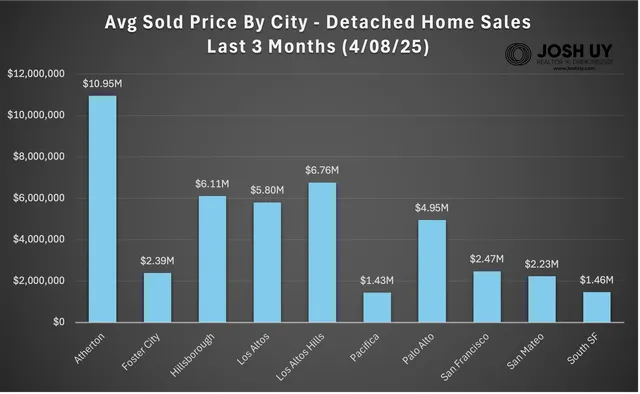
Bar chart of the average sold price of detached homes by city in San Francisco and the Peninsula over the last 3 months
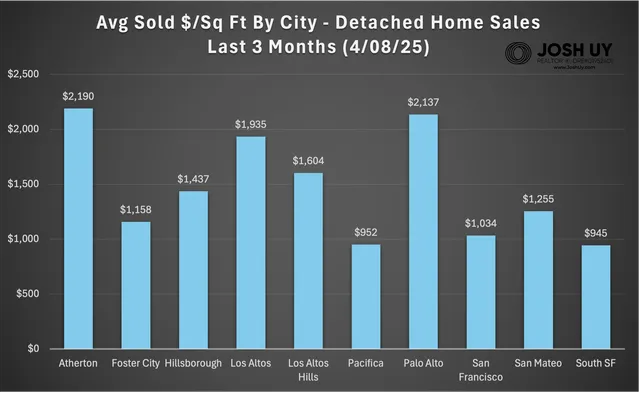
Bar chart of the average sold price per square foot of detached homes by city in San Francisco and the Peninsula over the last 3 months
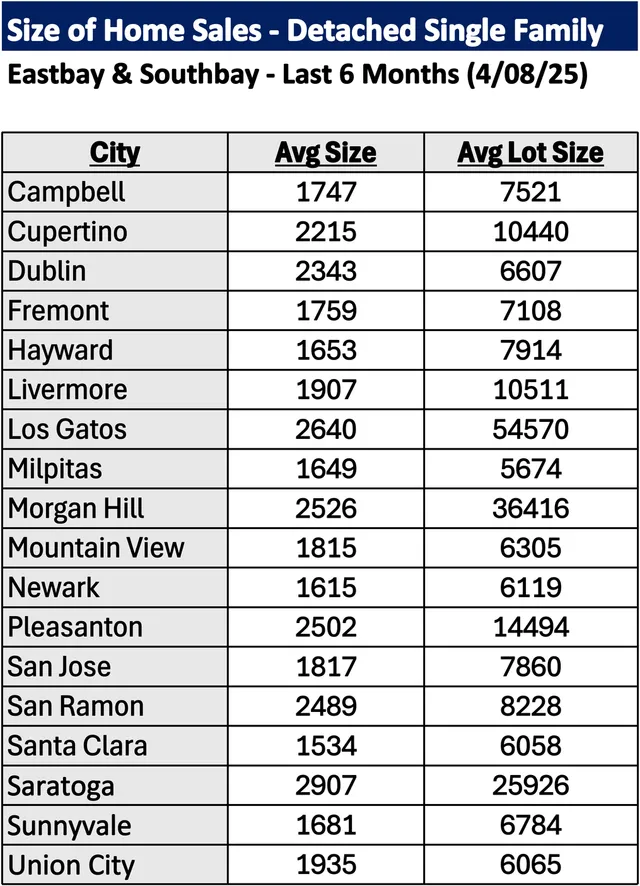
Table of the average home size and average lot size, in square feet, of detached single-family homes sold by city in the East Bay and South Bay over the last 6 months
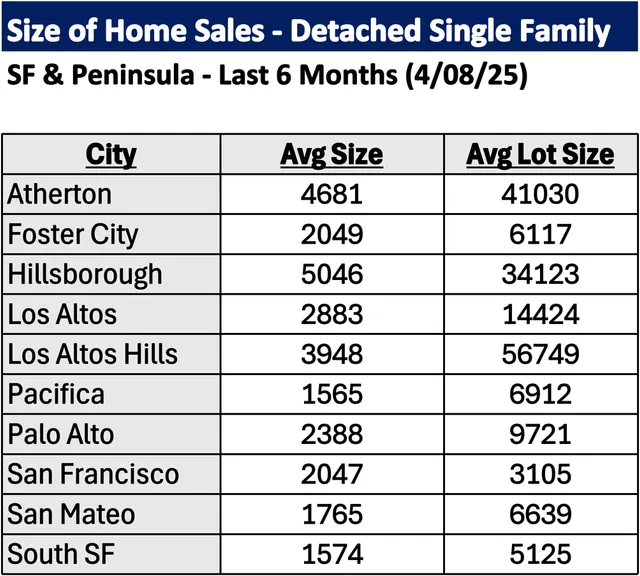
Table of the average home size and average lot size, in square feet, of detached single-family homes sold by city in San Francisco and the Peninsula over the last 6 months
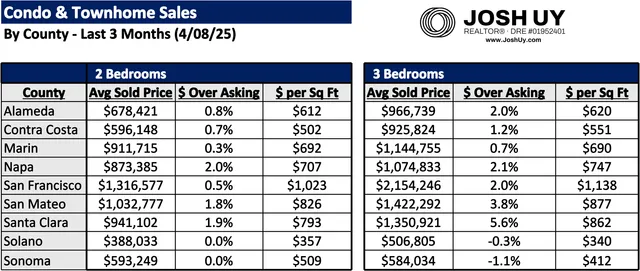
Table of condo and townhome sales by county over the last 3 months, for 2-bedroom and 3-bedroom units: average sold price, percent over asking, and price per square foot
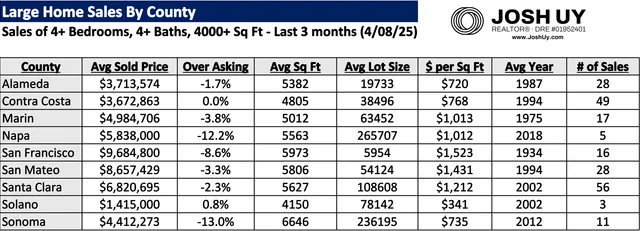
Table of large home sales by county (4+ bedrooms, 4+ bathrooms, 4,000+ square feet) over the last 3 months: average sold price, percent over asking, average square feet, average lot size, price per square foot, average year built, and number of sales

For more information on how these trends might affect your home values and/or the timing of your real estate moves, please reach out anytime. Note if your city is not listed here, a personalized analysis can be created upon request. You can also visit my website (www.JoshUy.com) which has additional resources for home buyers and home sellers. This sales data was provided by the Bayeast MLS Association and collected through 4/8/25. Data deemed reliable but not guaranteed and is subject to revision.


Visit my website!

Contact Josh Uy, REALTOR, DRE #01952401. Phone 510.449.7280. Email Josh@EverhomeRE.com. Website and QR code both link to www.JoshUy.com. Buying, selling, new homes, and investments.
Josh Uy
CallTextEmail