Bay Area Market Snapshot: February 2026


Did you know President’s Day was originally established to honor George Washington's birthday? First observed as a federal holiday in 1885, this year marks its 141st anniversary. In celebration of the occasion, the National Park Service is providing free admission to US residents at all 400+ national parks today! Speaking of our national treasures, let’s dive into some insights from the latest Bay Area real estate market data.
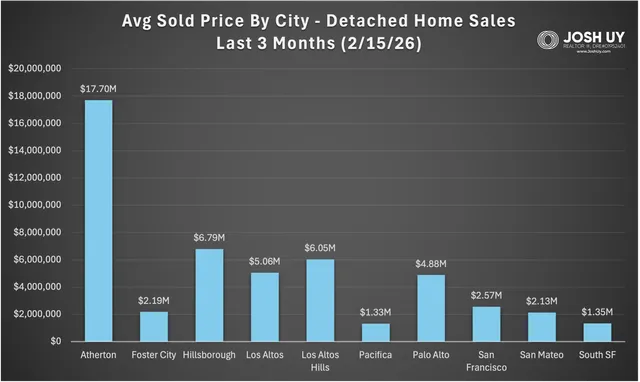
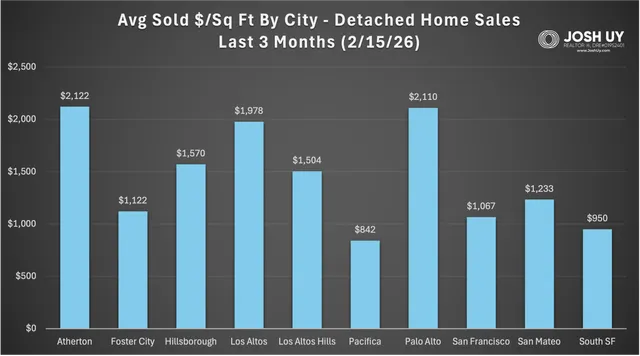
While some drop off was to be expected with the holidays, the number of sales (3 month figure) slid 20% in the Eastbay & Southbay, and nearly 31% in the SF & Peninsula area! Average sold price for the Eastbay & Southbay group was up 0.5% though, which has been pretty consistent since November. For the SF & Peninsula side, the gain was much larger, up 7% since last month. Top movers for price include Atherton at +21%, Mountain View +7.7%, Palo Alto +7.6%, also Fremont -5.5%, Pleasanton -6.2%, and Oakland -8%.
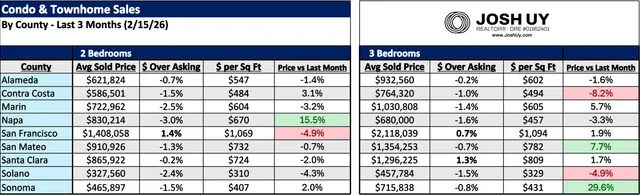
The 3 bedroom market outperformed the 2 bedroom group for condos & townhomes last month. Price for 3 bedrooms increased 2.7%, while the sold $/sq ft increased 1.2%. The 2 bedroom market went the opposite direction, as price dipped 0.1% and sold $/ sq ft 1.1%. For 2 beds, SF was the only county that sold above asking (1.4%) on average, while 3 beds were led by SF (0.7%) and Santa Clara (1.3%).
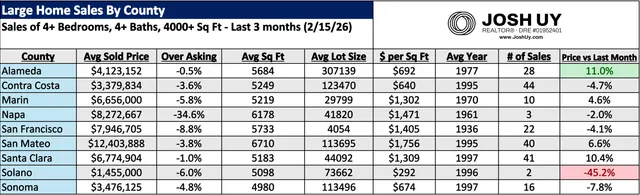
For the large homes market, the combined average number sold (3 month figure) fell 25%. Homes in this category sold under asking in all counties, with the average being -7.6%. Despite that figure, there were big gains seen for average sold price in Alameda, Santa Clara, and the San Mateo counties month over month. Combined average price was basically unchanged at -0.1% though, while average sold $/sq ft dipped 1.4%.
Feel free to reach out if you have any questions, I'd be more than happy to do a thorough / personalized analysis beyond this data. You can also check out my website for more resources & guides (www.joshuy.com).
Talk soon,
Josh
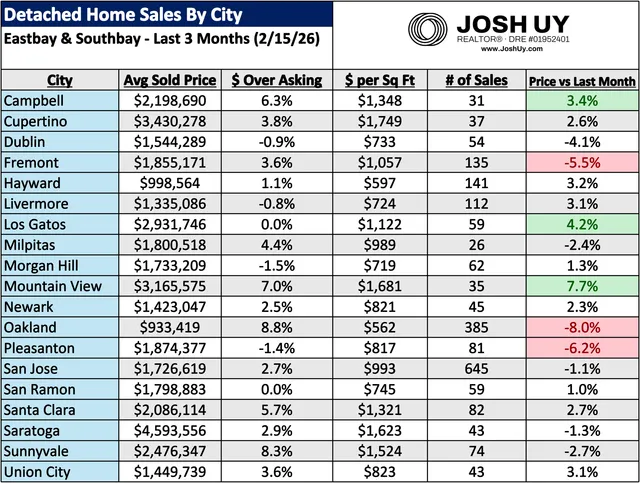
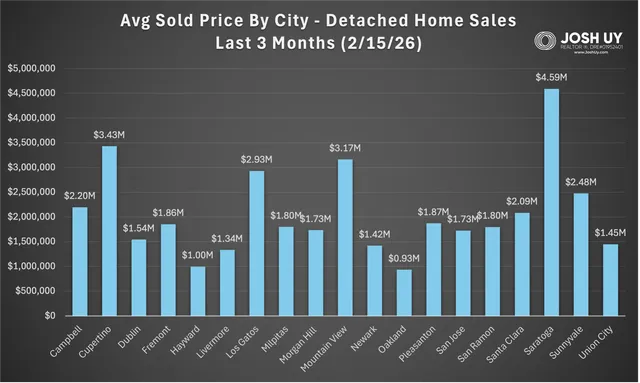
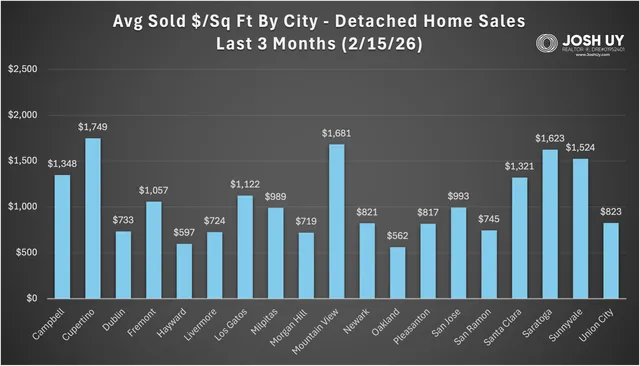
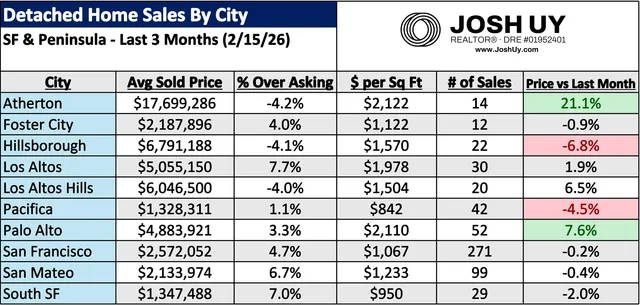
For more information on how these trends might affect your home values and/or the timing of your real estate moves, please reach out anytime. Note if your city is not listed here, a personalized analysis can be created upon request. You can also visit my website (www.JoshUy.com) which has additional resources for home buyers and home sellers. This sales data was provided by the Bayeast MLS Association and collected through 2/15/26. Data deemed reliable but not guaranteed and is subject to revision.