Bay Area Market Snapshot: April 2026


Good morning! Between the rush of the spring market, the whirlwind of spring break activities, and the looming tax deadline, April often feels like a sprint. It's easy to get lost in the noise of the "hot" season and an ever changing news cycle, but the key to staying ahead is focusing on the signals rather than the static. This month, we're diving into the essential data to help you decipher what's happening in the market.
As expected with the season, the number of sales for both groups rose significantly, increasing 27.5% for the Eastbay & Southbay side and 35.3% on the SF & Peninsula side. Average price also saw some movement, rising 1.8% from last month's figure in the Eastbay & Southbay, but ended up at -4.9% for SF & Peninsula (which was skewed by Atherton's price drops/return to more "normal" prices). Just FYI without Atherton in the mix, average price would have been up by 2.1% for that group. Also note both groups also had an increase for average sold $ / sq ft. Top movers for price include: San Mateo at +17.1%, Oakland +11.8%, SF +10.3%, Hayward +8.5%, while pullbacks were seen with Milpitas -2%, Foster City -3%, and Atherton at -19.7%.
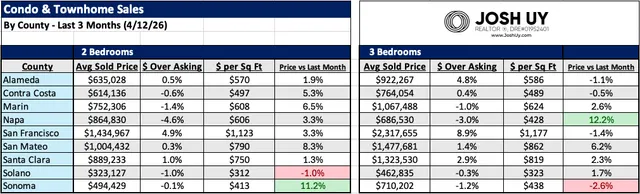
The condos & townhomes market saw similar action, as both the average sold price and sold $ / sq ft figures increased for the 2 & 3 bedroom groups. Price for a typical 2 bed home went up 4.4% to $779K, while $ / sq ft gained 2.6% to land at $630/ sq ft. For a 3 typical 3 bed home, prices increased 1.7% to $1.08M, while $ / sq ft increased 1.9% to end up at $639/sq ft. For the most part, a majority of the counties saw price gains compared to last month's figures (14 out of 19 were positive). For the 2 bed market, Solano County was the only one negative (at -1%), while a couple Counties including San Mateo (+8.3%) and Sonoma (+11.2%) had huge months. For the 3 bed side, Sonoma was the leader to the downside (at -2.6%), while San Mateo (+6.2%) and Napa (+12.2%) carved out some gains.
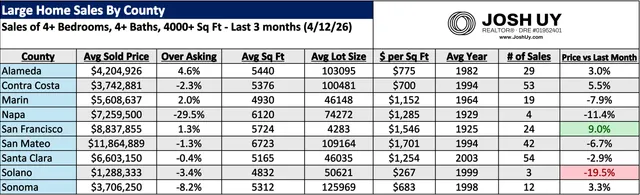
In the large homes sector, combined number of sales shot up, increasing 33% vs our figure from last month. While number of sold homes went up, we saw dips for both average sold price (-3% to $5.9M) and average sold $ / sq ft (-1.4% to $1040/sq ft). Price wise, all 9 counties saw significant moves (each moving a minimum of 3%), notably: Solano at -19.5%, Napa -11.4%, plus Contra Costa +5.5%, and SF at +9%.
Feel free to reach out if you have any questions, I'd be more than happy to do a thorough / personalized analysis beyond this data. You can also check out my website for more resources & guides (www.joshuy.com).
Talk soon,
Josh
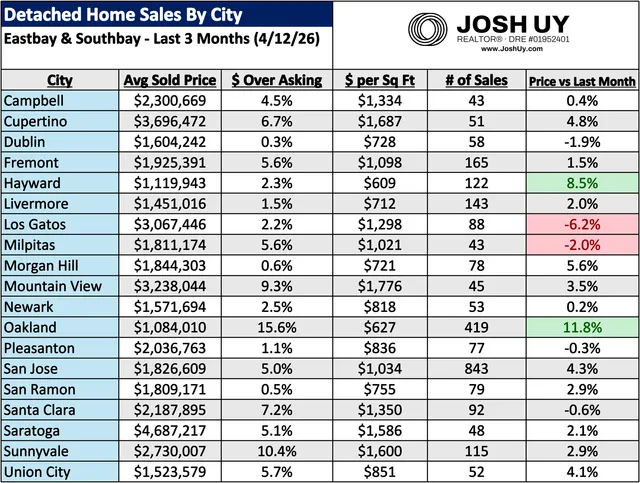
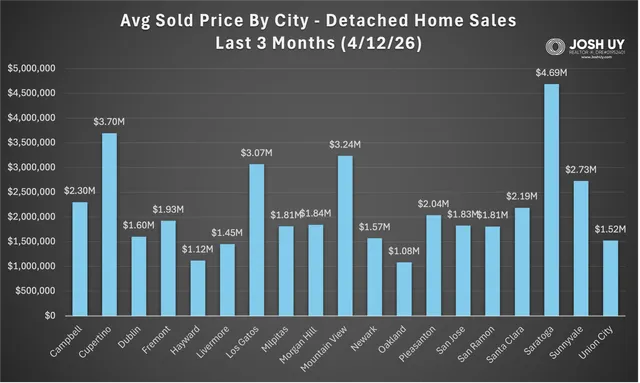
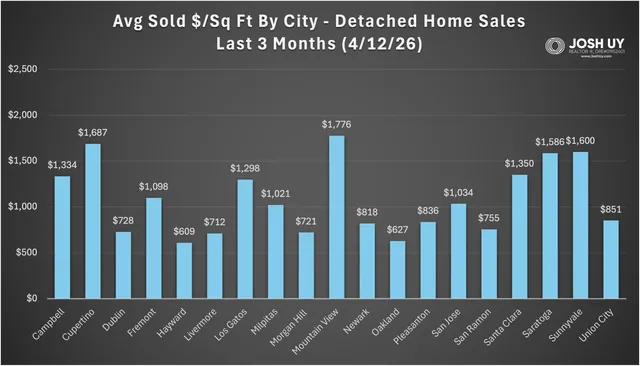
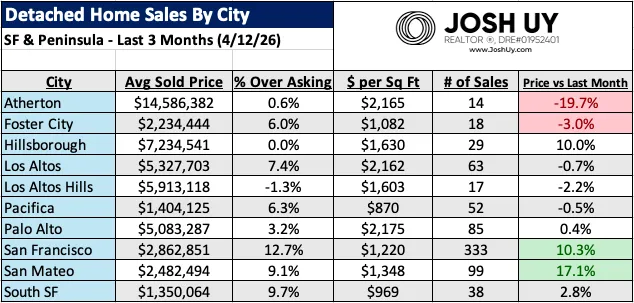
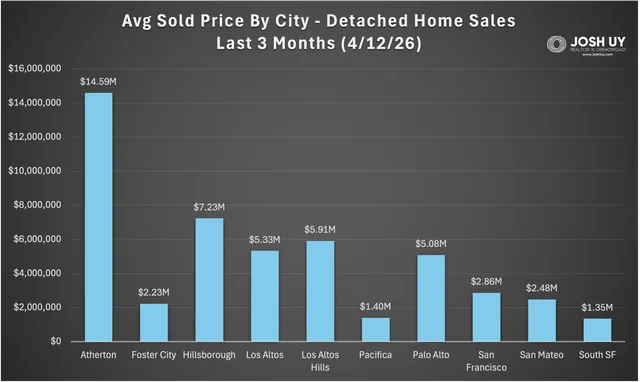
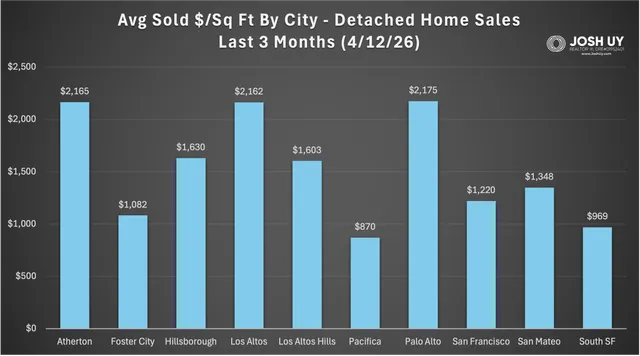
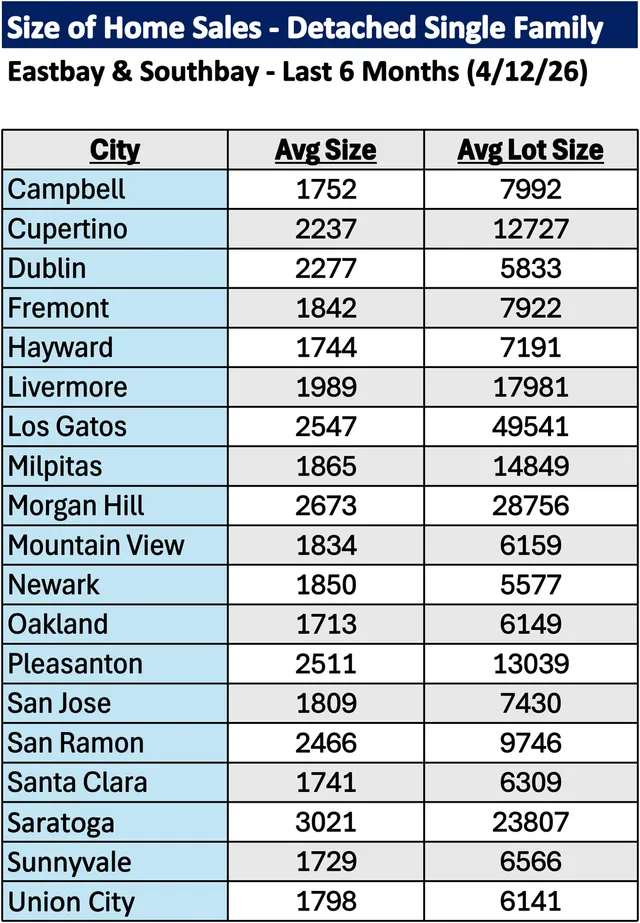
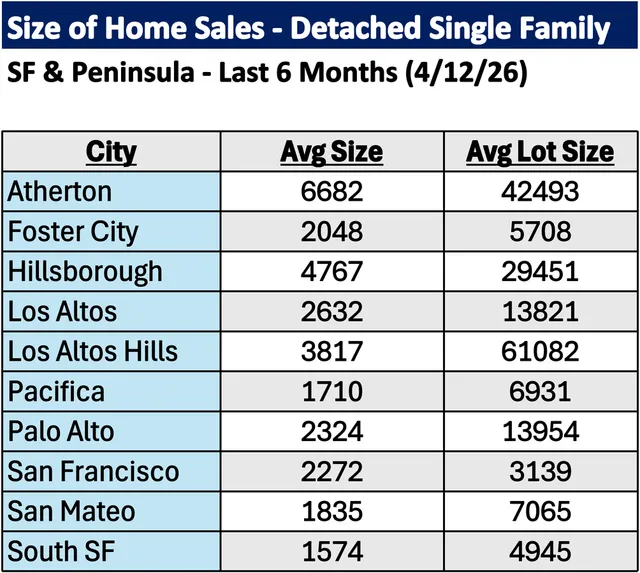
For more information on how these trends might affect your home values and/or the timing of your real estate moves, please reach out anytime. Note if your city is not listed here, a personalized analysis can be created upon request. You can also visit my website (www.JoshUy.com) which has additional resources for home buyers and home sellers. This sales data was provided by the Bayeast MLS Association and collected through 4/12/26. Data deemed reliable but not guaranteed and is subject to revision.