Bay Area Market Snapshot: August 2025


Good morning! Did you know today August 9th is recognized as national passion fruit day? This sweet and tangy tropical fruit got its name from Spanish missionaries, who discovered it in southern Brazil back in 1820. While it is native to South America (particularly Brazil, Paraguay, and northern Argentina), passion fruit is also grown in other tropical parts of the world such as central America, Africa, Australia, and Hawaii. While the conditions to grow the fruit may not be as ideal here in the Bay Area, the good news is our real estate market has been holding up well throughout the summer.
For detached single family homes, Hillsborough led the way for the SF & Peninsula side, seeing an 8.8% increase vs last month's average sold price. Also coming in strong was Palo Alto with a gain of 5.6%, while the Eastbay & Southbay were led by Fremont at +2.1% and Saratoga at +2.7%. On the downside, the biggest decliners were Pacifica at -4.5% and San Mateo at -2.2%, along with Morgan Hill -3.9% and Campbell -5.4%. In comparison to last month's figures, the combined number of sales was nearly the same at +0.2% on the Eastbay & Southbay side, while the SF & Peninsula group was down -2.2%.
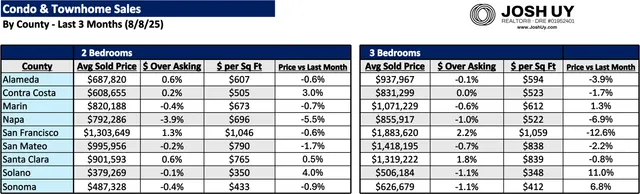
The condo & townhome market appeared to take a step back in few areas, with Solano County being the exception as it led the way with the highest gain for 2 bedrooms at +4% and for 3 bedrooms at +11%! On the downside, the biggest decline for 2 bedrooms was Napa County at -5.5%, while San Francisco represented the 3 bedroom units with a -12.6% drop. Note SF will have a handful of luxury 3 bedroom condominium sales every now and then, so these can swing its price average a bit (especially when they are selling at $10M+).
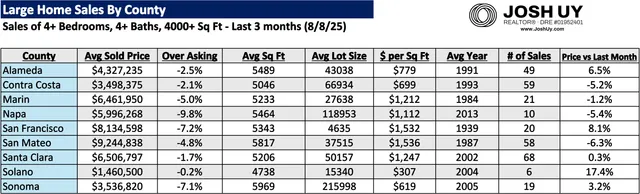
In the large homes sector, Solano County led the way again, posting a huge 17.4% gain vs last month's average sold price. San Francisco also had a strong month with an 8.1% gain. On the downside, we had Napa County at -5.4% and San Mateo County at -6.3%. Interestingly, all 9 counties had a below asking figure, with the average at -4.5% under. Alameda County had another solid month, with the typical home now selling for $4.33M (up 33% since May). Combined number of sales was pretty similar to last month, with a modest 1.3% increase.
Feel free to reach out if you have any questions, I'd be more than happy to do a thorough / personalized analysis beyond this data. You can also check out my website for more resources & guides (www.joshuy.com).
Talk soon,
Josh
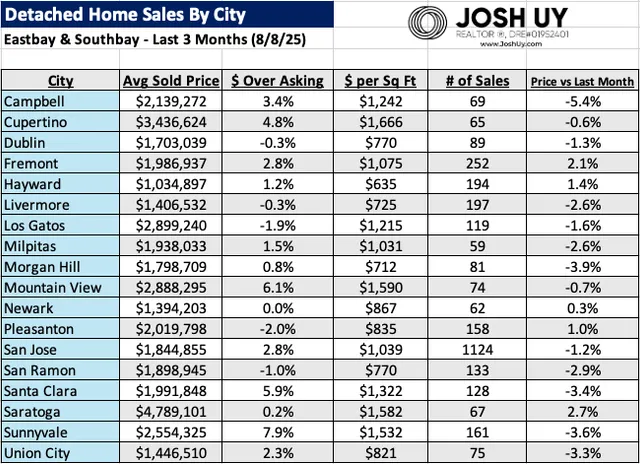
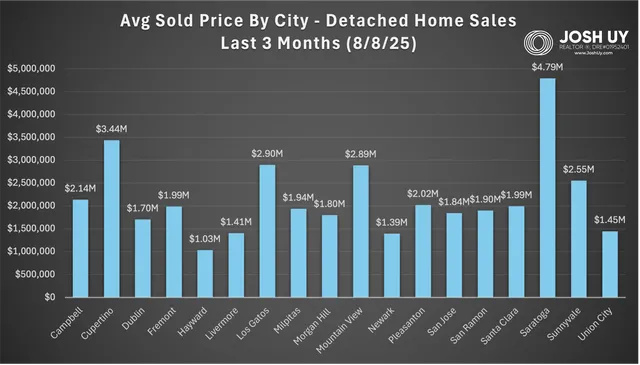
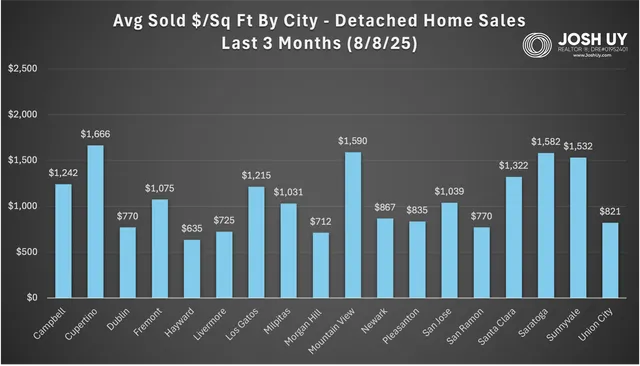
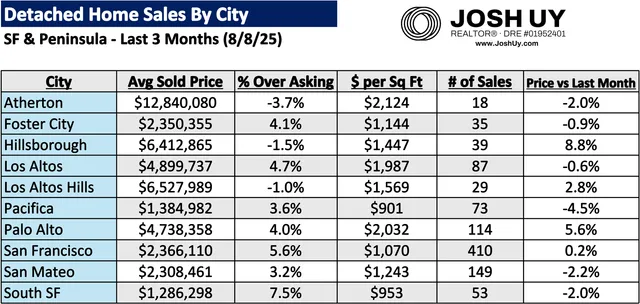
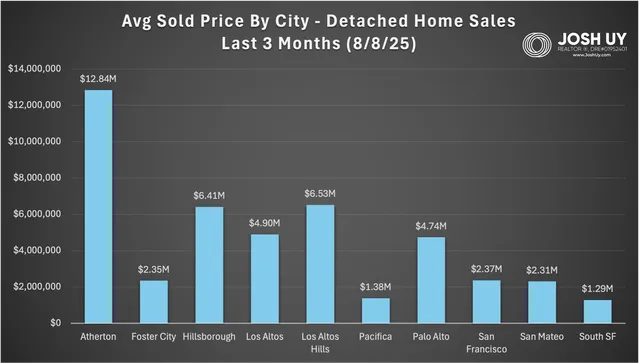
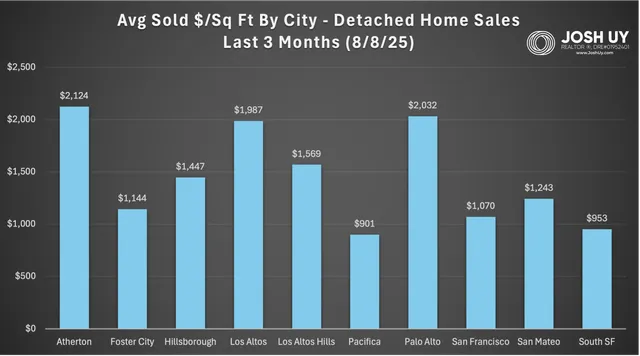
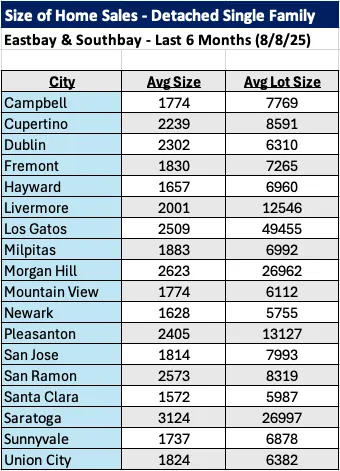
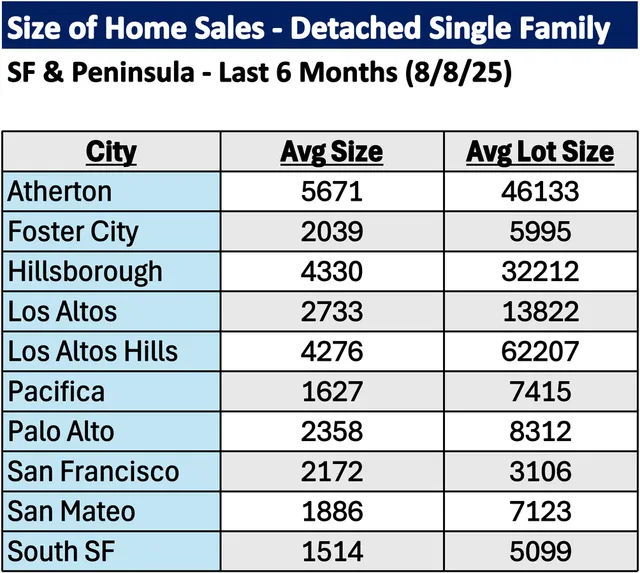
For more information on how these trends might affect your home values and/or the timing of your real estate moves, please reach out anytime. Note if your city is not listed here, a personalized analysis can be created upon request. You can also visit my website (www.JoshUy.com) which has additional resources for home buyers and home sellers. This sales data was provided by the Bayeast MLS Association and collected through 8/8/25. Data deemed reliable but not guaranteed and is subject to revision.