Bay Area Market Snapshot: December 2025


Good morning & Happy Holidays! The Federal Reserve announced another 25 basis point cut (0.25%) to its benchmark rate yesterday, which was the third straight rate cut to end the year. While this was certainly positive news, mortgage rates have not felt the benefits yet, as these cuts were already priced in (widely expected, with 30 year rates around 6.3% today). Looking ahead to next year, the Fed is projecting a potential pause or just one additional cut. For mortgage rates to see a meaningful change in 2026, we'll need a combination of a sustained Fed easing policy, declining Treasury yields, and more favorable economic conditions. All things considered, we are expecting mortgage rates to decline gradually, rather than drop sharply.
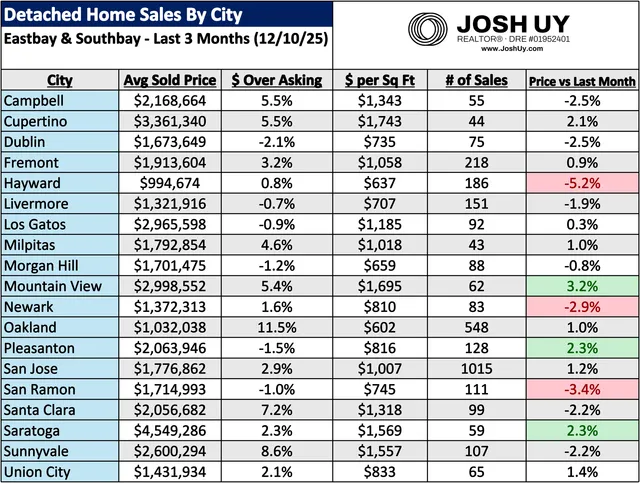
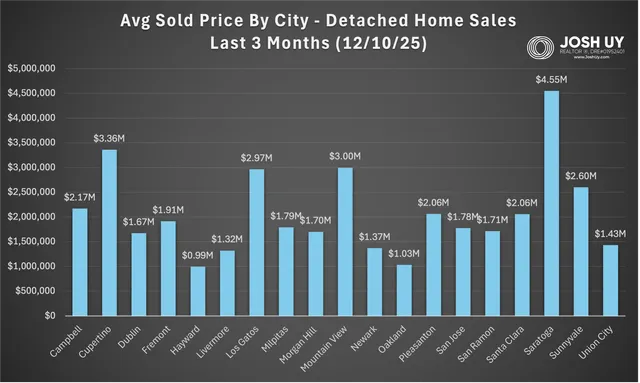
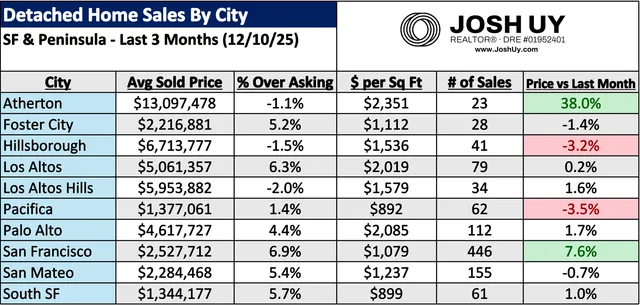
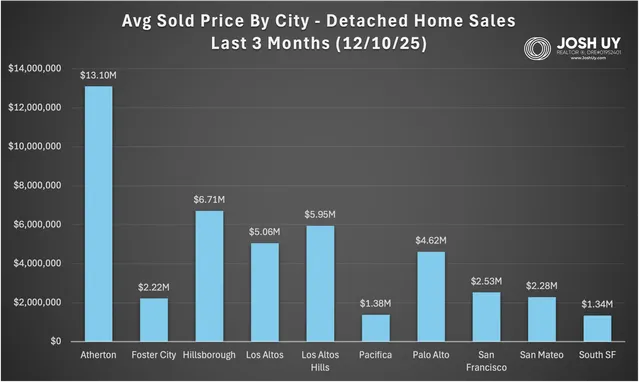
Atherton took an gigantic leap compared to last month, by far outpacing any other city with a staggering 38% jump in average sold price! FYI though, the huge increase can be attributed to five recently closed mansions at $18M, $20M, $23M, $23.2M, and $45.5M (4 of the 5 were CASH sales 😵💫). San Francisco also had a strong month, with a 7.6% increase. On the Eastbay & Southbay side the gains were more modest, with Mountain View pacing the way at +3.2%, followed by Pleasanton & Saratoga at +2.3%. Hayward led the way on the downside at -5.2%, followed by San Ramon at -3.4%. For the SF & Peninsula group, Pacifica had the largest dip at -3.5%, followed by Hillsborough at -3.2%. Compared to last month's data, combined number of sales was up 4.5% for the SF & Peninsula side, while the Eastbay & Southbay was down 3.9%.
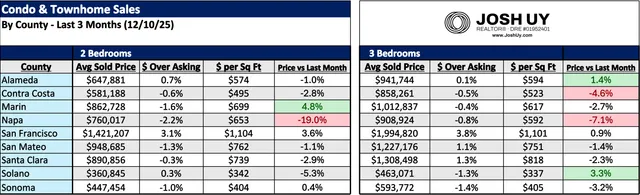
The condo & townhome market had okay numbers, seeing both the 2 and 3 bedroom markets generally soften (combined average sale prices dipped 2.4% for 2 beds and 1.7% for 3 beds). For the 2 bedroom group, Marin County led the way, with a 4.8% increase from last month, followed by SF at +3.6%. On the 3 bedroom side, Solano County had the largest gain at +3.3%. Napa County was the downside leader for both the 2 and 3 bedroom markets, at -19% (for 2 beds) and -7.1% (for 3 beds), but these were mostly due to smaller sample sizes / some larger sales.
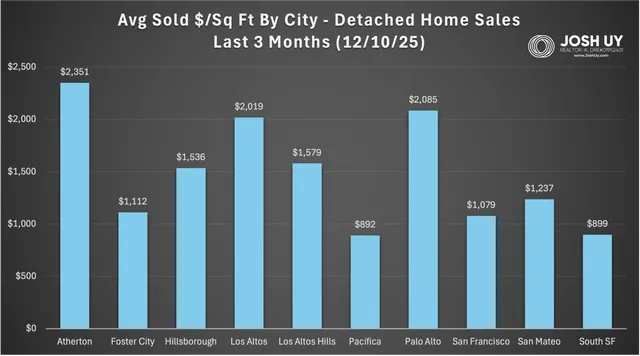
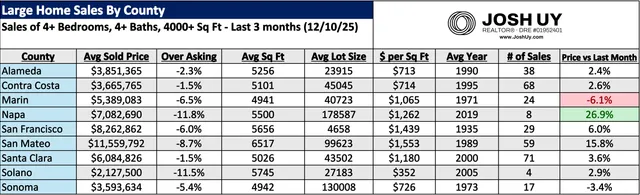
In the large homes sector, we had some bigger movement seen in: Napa County (+26.9%), San Mateo (+15.8%), and Marin (-6.1%), but also note 7 of the 9 counties saw price gains! Napa County was boosted by a larger $12.7M sale in St Helena, while San Mateo County had help from a few properties (including the Atherton ones) selling between $23M-$56M. It was the opposite effect in Marin County for the month, as some larger/higher priced sales left the data set. Combined average sales price is up 7.3%, while average sold $ / sq ft is up 2.7%. Combined number of sales has also increased, with a 6.4% gain compared to last month's figure.
Feel free to reach out if you have any questions, I'd be more than happy to do a thorough / personalized analysis beyond this data. You can also check out my website for more resources & guides (www.joshuy.com).
Talk soon,
Josh
For more information on how these trends might affect your home values and/or the timing of your real estate moves, please reach out anytime. Note if your city is not listed here, a personalized analysis can be created upon request. You can also visit my website (www.JoshUy.com) which has additional resources for home buyers and home sellers. This sales data was provided by the Bayeast MLS Association and collected through 12/10/25. Data deemed reliable but not guaranteed and is subject to revision.