Bay Area Market Snapshot: May 2026


Good morning! As we reach the peak of the spring market, it's worth noting that May is the National Home Remodeling month! While many might jump to high impact upgrades like shiny fixtures & lighting, new paint, flooring, or energy efficiency boosts, this is also the ideal time to tackle essential maintenance items such as HVAC tuning, landscaping, exterior cleaning, and any overdue repairs. Whether you are contemplating a move soon or simply want to increase your equity, these strategic improvements are key to staying ahead in today's market!
As expected with the season, sales volume continues to climb. Number of sales grew for both groups, increasing 22.6% for the Eastbay & Southbay side and 32.8% on the SF & Peninsula side since last month. While volume was up, average prices remained stable (0.2% for Eastbay & Southbay, 0% for SF & Peninsula). However, core Bay Area hubs remain incredibly competitive, such as: Oakland (18.5% over asking), SF (15.8% over), San Mateo & Sunnyvale (10% over). Notably the typical single family home in SF jumped from $2.6M in March to now $3.05M (a 17.2% gain)! Interesting to see some areas like that booming, while others are more stagnant and leaning towards a buyer's market. Top movers for price include: Hillsborough & Campbell at +7.2%, Oakland +6.8%, SF +6.4%, while some were dipping like Los Altos -4.2%, Union City -4.7%, Morgan Hill -4.9%, and Atherton at -5.4%.
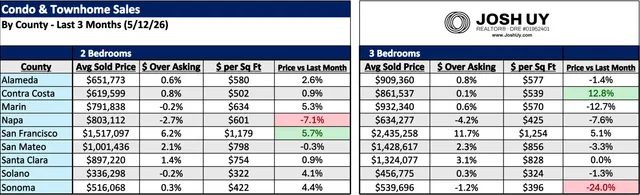
Sales for the condos & townhomes market showed mixed results, as the 2 bedroom group had healthy gains, while the 3 bedroom side made less traction. Price for a typical 2 bedroom home increased 1.7% to $793K, while sold $ / sq ft increased 2.2% to $643 / sq ft. For the 3 bedroom market, average price fell 2.2% to $1.06M, while sold $ / sq ft gained 0.4% to land at $641 / sq ft. Compared to last month's figure for 2 beds, most counties saw their average price increase except for San Mateo and Napa counties, with the largest moves being Napa -7.1%, Marin +5.3%, and SF +5.7%. The price action was much more drastic for the 3 bedroom market, seeing -24% for Sonoma, -12.7% for Marin, and +12.8% for Contra Costa!
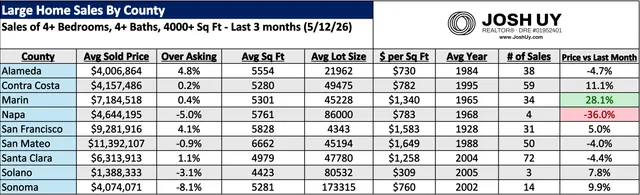
Action for the luxury homes sector was similar to the broader single family seasonal trends, seeing sales volume surge (27.1% increase for our 3 month figure) but with homes selling for relatively the same amount. Price wise, we dipped 1.3% to a $5.83M average, while average sold $ / sq ft dipped 1.8% to land at $1021 / sq ft. Movements compared to last month's price figures were quite large in some pockets like Solano +7.8%, Sonoma +9.9%, Contra Costa +11.1%, Marin +28.1%, and Napa -36% (low sample size).
Feel free to reach out if you have any questions, I'd be more than happy to do a thorough / personalized analysis beyond this data. You can also check out my website for more resources & guides (www.joshuy.com).
Talk soon,
Josh Uy
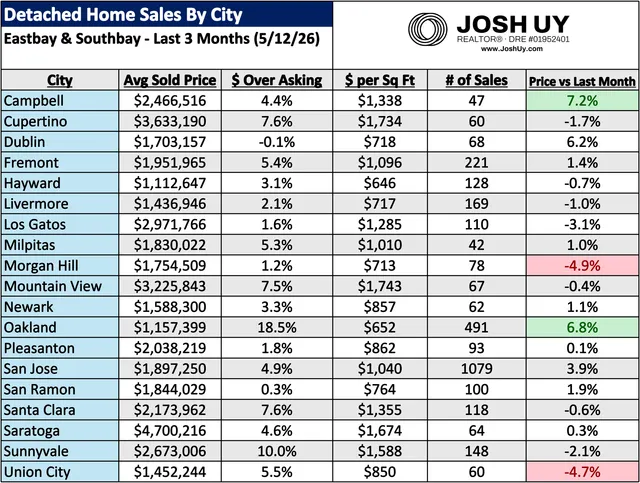
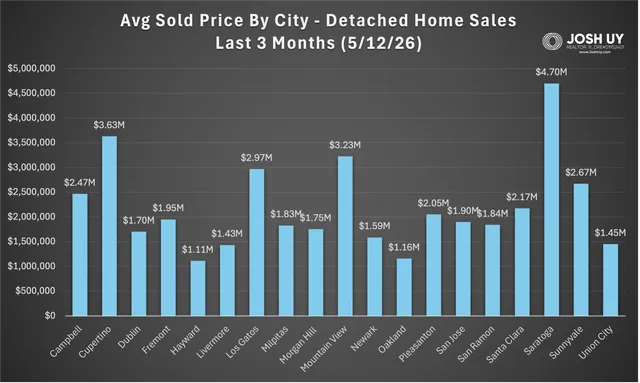
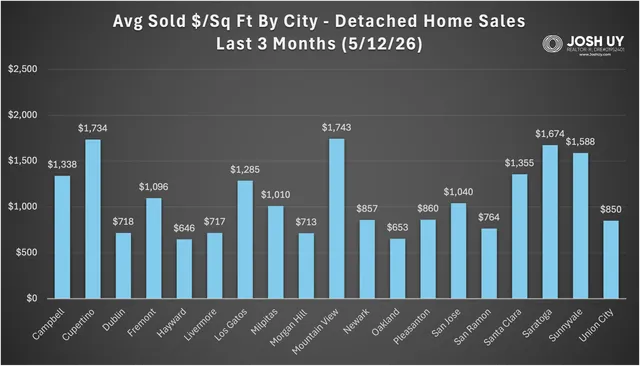
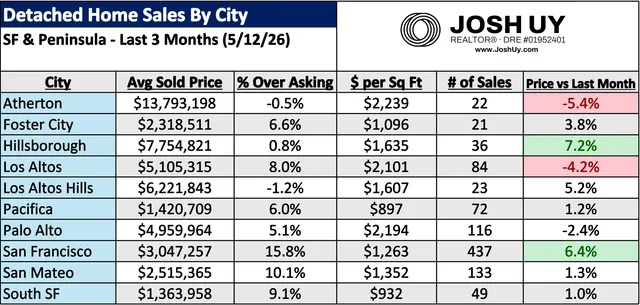
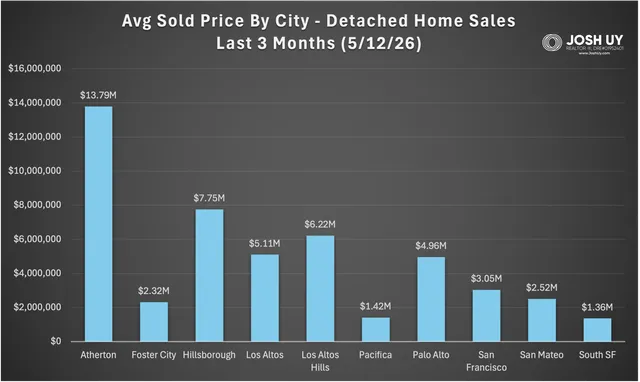
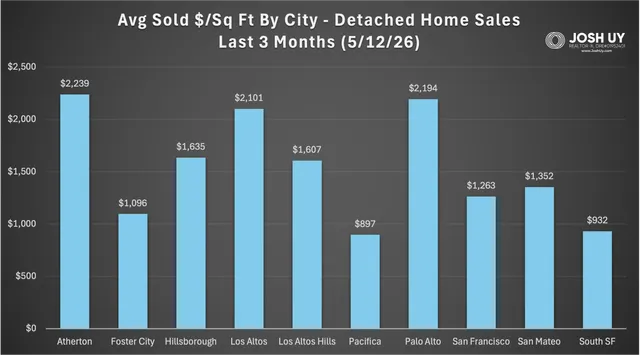
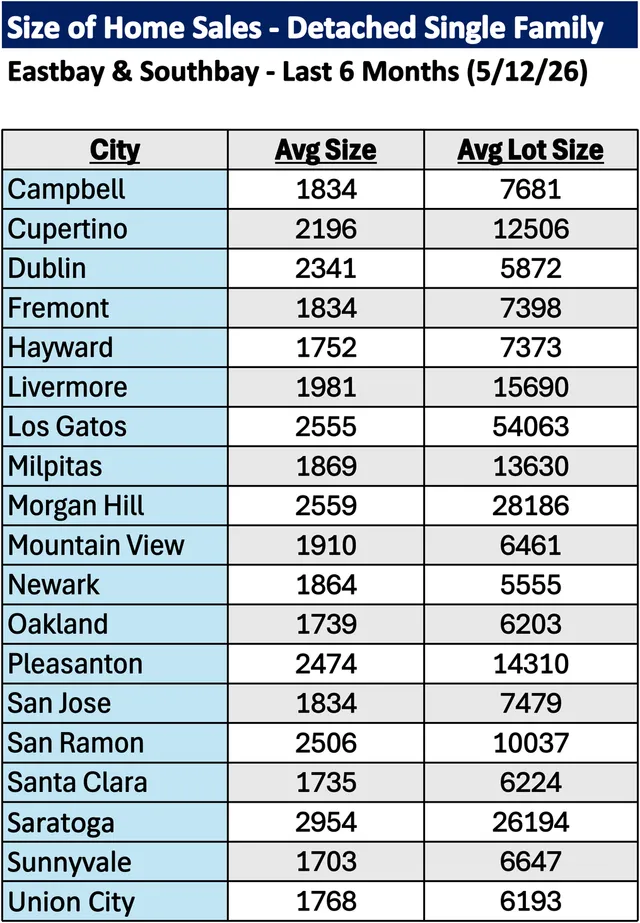
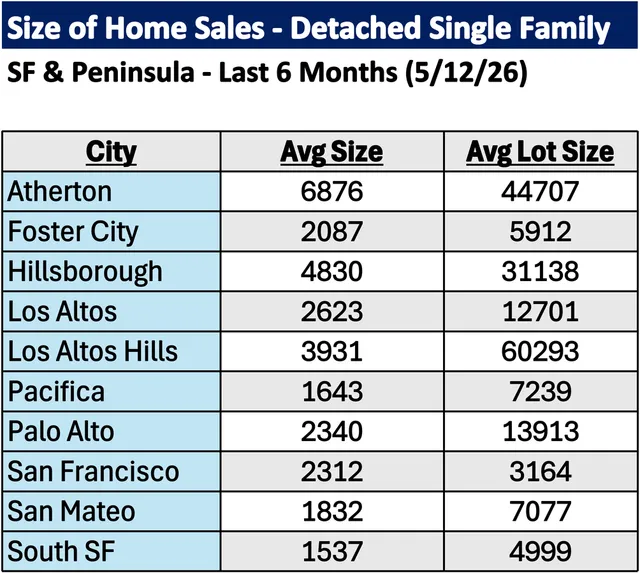
For more information on how these trends might affect your home values and/or the timing of your real estate moves, please reach out anytime. Note if your city is not listed here, a personalized analysis can be created upon request. You can also visit my website (www.JoshUy.com) which has additional resources for home buyers and home sellers. This sales data was provided by the Bayeast MLS Association and collected through 5/12/26. Data deemed reliable but not guaranteed and is subject to revision.