Bay Area Market Snapshot: November 2025


Veteran's Day (Nov 11th) is a time for Americans to honor the brave individuals who have served in our military. Regardless of your views of the military or war in general, respect & gratitude can always be shown towards the veterans who have selflessly fought to protect our freedom 🇺🇸. In that spirit, today’s newsletter spotlights real estate data in the Bay Area, who is fighting its own battle with affordability issues for homeownership. Though this report is from late July, check out SmartAsset’s study of America’s Most Expensive Housing Markets. For the second year in a row, all five of the top spots are from California (SJ #1, SF #2, LA #3, SD #4, Oxnard at #5)!
At the city level, South SF and Hillsborough (again) were the top gainers this month for the SF & Peninsula group, seeing their average price increase by 6.3% and 5.8% vs last month. For the Eastbay & Southbay gang, Los Gatos had the highest increase at +5%, followed by Santa Clara at +3.7%. On the downside, Los Altos Hills had a -11.8% drop, while Palo Alto fell 5.2%. Note the price drop for Los Altos Hills was mostly due to a few larger homes that were present in October's data, but not there for this month's dataset (sales at $10.5M, $12M, and $15.7M). The numbers for Eastbay & Southbay on the downside were less drastic, with the most extreme being Saratoga at -3.9% and Milpitas at -3.2%. Compared to last month's data, the combined number of sales was up 6.8% for the SF & Peninsula side, while the Eastbay & Southbay saw 2.4% less sales.
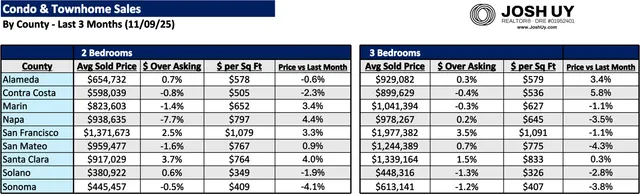
The condo & townhome market had some mixed results, seeing slight gains for the 2 bedroom market, while the 3 bedroom market went the opposite way with some small dips. The 2 bedroom group had some gains for both average price and average sold $ / sq ft, with the leader being Napa County at +4.4%, followed by Santa Clara County at +4%. On the downside, Sonoma County had the largest drop at -4.1%. For the 3 bedroom group, Sonoma also showed up as having one of the largest dips at -3.8%, just behind San Mateo County at -4.3%. On the plus side, Contra Costa County led the way at +5.8%, followed by Alameda County at +3.4%. On average, the 3 bedroom market dipped slightly for both average price and average sold $ / sq ft.
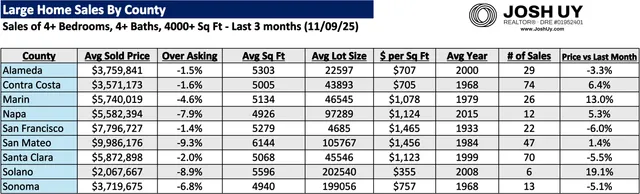
In the large homes sector, Solano County led the way with the highest gain at +19.1% vs last month's figure, carried by a larger $4M sale (almost 10K sq ft living area) that brought up the averages. Also having a strong month was Marin County with a huge 13% gain! While SF had the highest gains last month, it fell 6% to become the loss leader for this month. Not too far behind was Santa Clara County at -5.5%. Note for San Mateo County, the $85M Woodside sale is still showing up in the dataset, which explains why the over asking figure remains around 9-10% below. Combined number of sales jumped from last month, increasing by 8.7%!
Feel free to reach out if you have any questions, I'd be more than happy to do a thorough / personalized analysis beyond this data. You can also check out my website for more resources & guides (www.joshuy.com).
Talk soon,
Josh
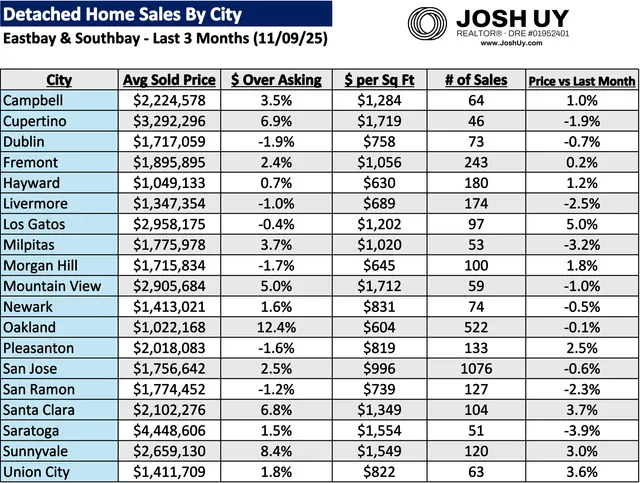
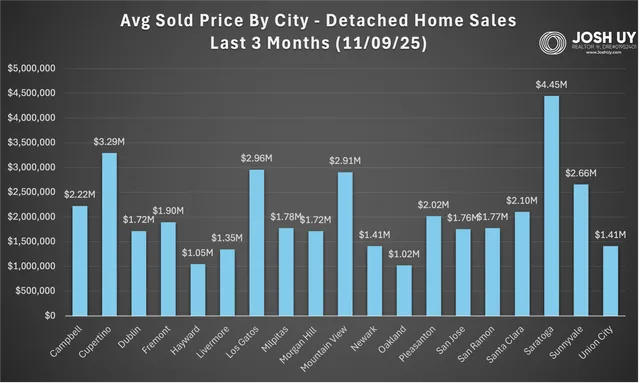
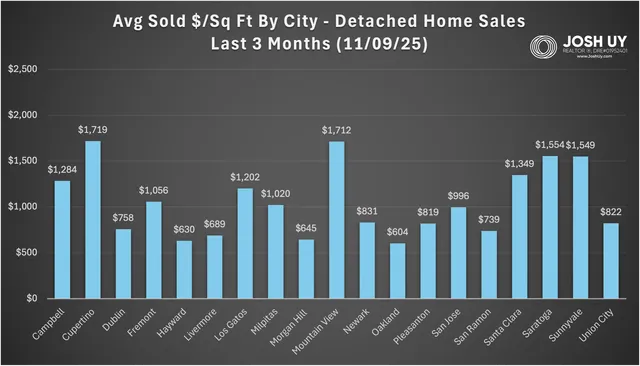
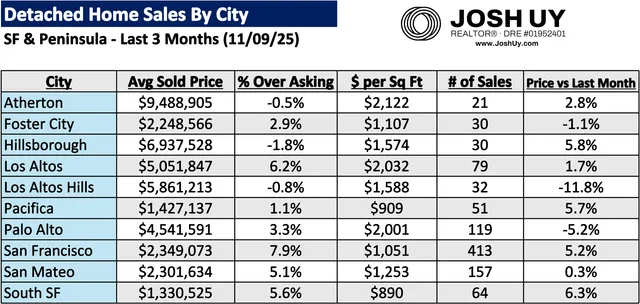
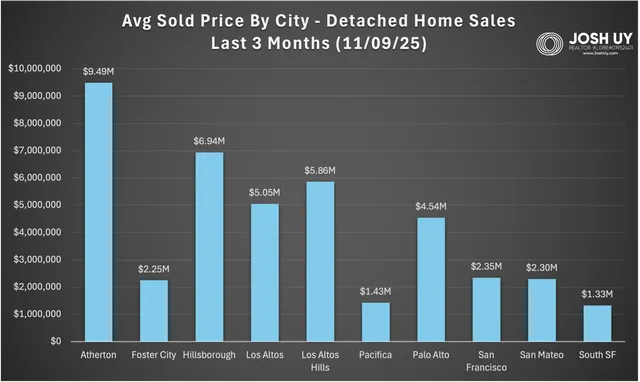
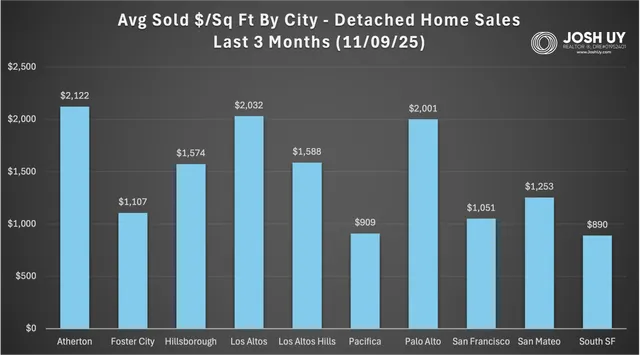
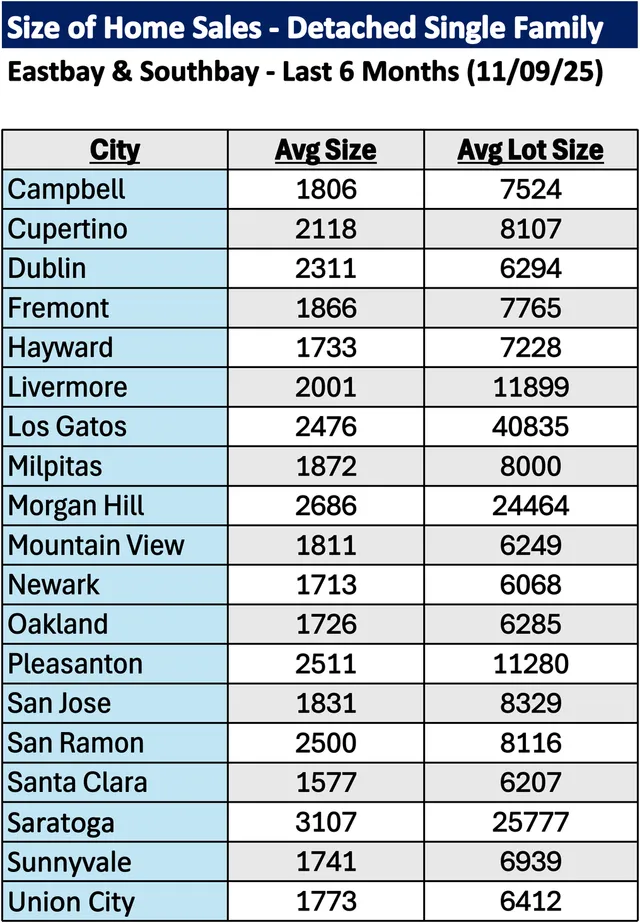
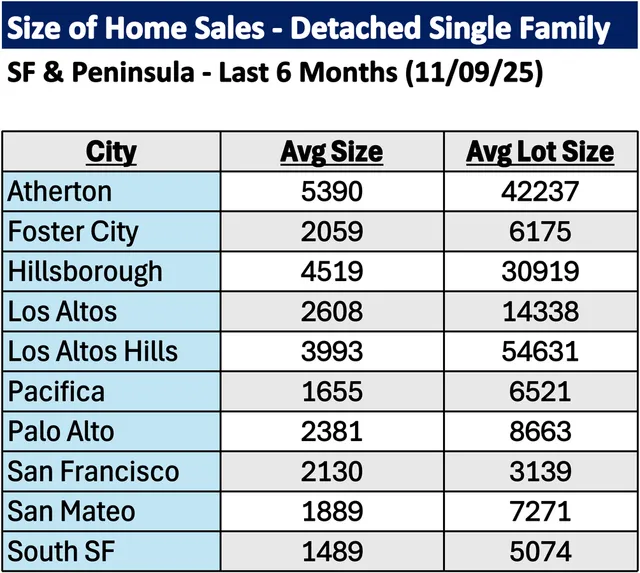
For more information on how these trends might affect your home values and/or the timing of your real estate moves, please reach out anytime. Note if your city is not listed here, a personalized analysis can be created upon request. You can also visit my website (www.JoshUy.com) which has additional resources for home buyers and home sellers. This sales data was provided by the Bayeast MLS Association and collected through 11/09/25. Data deemed reliable but not guaranteed and is subject to revision.