Bay Area Market Snapshot: June 2026


Hope your day is going well! What a historic day we had on Friday, as SpaceX (ticker SPCX) made its long-awaited stock market debut. Pricing at $135 per share at a rough valuation of $1.75T, this was by far the largest IPO in market history! To put that into perspective, at that valuation SpaceX instantly slots in as one of the 7 most valuable companies in the world, leapfrogging giants like Tesla, Saudi Aramco, and Broadcom. While SpaceX is busy redefining what it means to launch, the local real estate market is telling a tale of two different trajectories. We aren't seeing a unified takeoff right now; instead, our core hubs stayed fiercely competitive, while a handful of pockets have cooled down to offer a more balanced market for buyers.
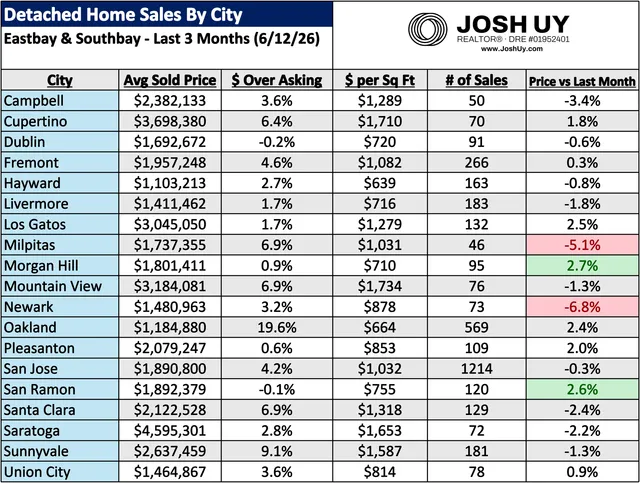
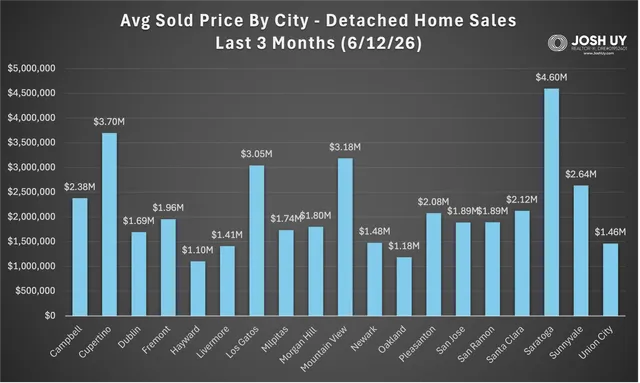
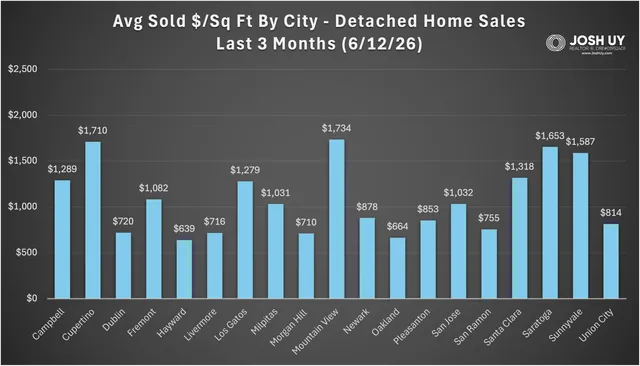
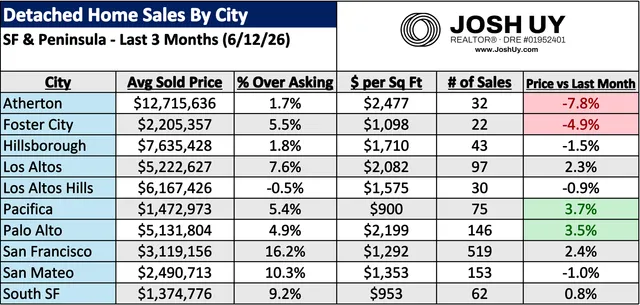
The transition into summer has been keeping the market busy! We logged 3717 sales for the Eastbay & Southbay side (16% increase) for our 3 month rolling average, while SF & Peninsula had 1179 sales for the period (18.7% increase). While volume was up big again, the combined average price remained flat / experienced a small dip. For the Eastbay & Southbay group, price dipped 0.6% to a $2.18M average, while sold $ / sq ft fell 0.9% to $1077 / sq ft. On the SF & Peninsula side, price dropped 2% to a $4.75M average, while sold $ / sq ft managed a 2.1% gain to land at $1564 / sq ft. The core hubs remain wildly competitive, being led by: Oakland (19.6% over), SF (16% over), San Mateo (10.3% over), South SF (9.2% over), and Sunnyvale (9.1% over). A handful of pockets stayed cooler and remained a more balanced market, particularly in the Tri Valley area, which were mostly landing right around or just under asking. Top movers for price vs last month's figures: Atherton -7.8%, Newark -6.8%, Milpitas -5.1%, and Foster City at -4.9%; while the upside was led by San Ramon +2.6%, Morgan Hill +2.7%, Palo Alto +3.5%, and Pacifica at +3.7%.
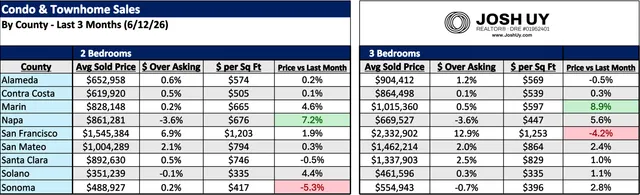
The condos & townhomes market finished with some gains all around, with the average price for the 2 bedroom group increasing 1.5% to climb to $805K, while the 3 bedroom group gained 0.9% to land at a $1.07M figure. The strength displayed in SF is incredible to see, as both the 2 and 3 bedroom segments (selling 6.9% & 12.9% over asking) were presumably fueled by tech/AI money. Biggest price movers for 2 beds vs last month's figures include: Sonoma County -5.3%, Marin County +4.6%, and Napa County +7.2%. For the 3 bed side, it was: SF -4.2%, Napa County +5.6%, and Marin County +8.9%. Both groups finished with gains for average price in 7 out of the 9 counties!
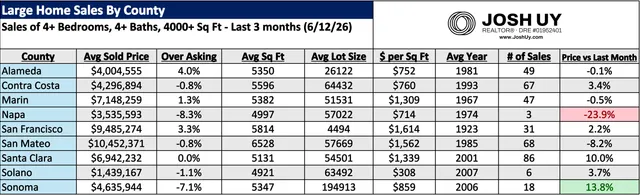
Sales volume for large homes sector surged yet again, finishing 23% higher for our 3 month figure (375 sales vs 305 last month), while prices stayed relatively flat or just under. Sold price fell 1% to land at a $5.77M average, while sold $ / sq ft gained 0.3% to finish at $1024/ sq ft. Price action was quite mixed across the board, seeing big movements in some areas: the usual contender Napa County at -23.9% (low sample size of 3 homes), San Mateo County -8.2%, Santa Clara County +10%, and Sonoma County at +13.8%.
Feel free to reach out if you have any questions, I'd be more than happy to do a thorough / personalized analysis beyond this data. You can also check out my website for more resources & guides (www.joshuy.com).
Talk soon,
Josh Uy
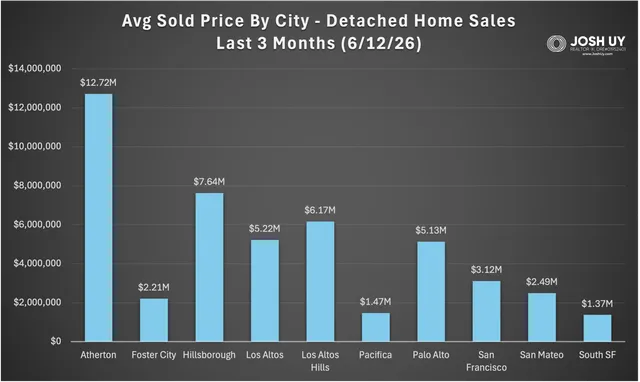
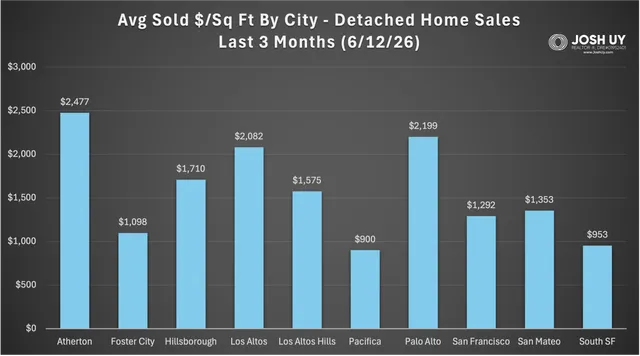
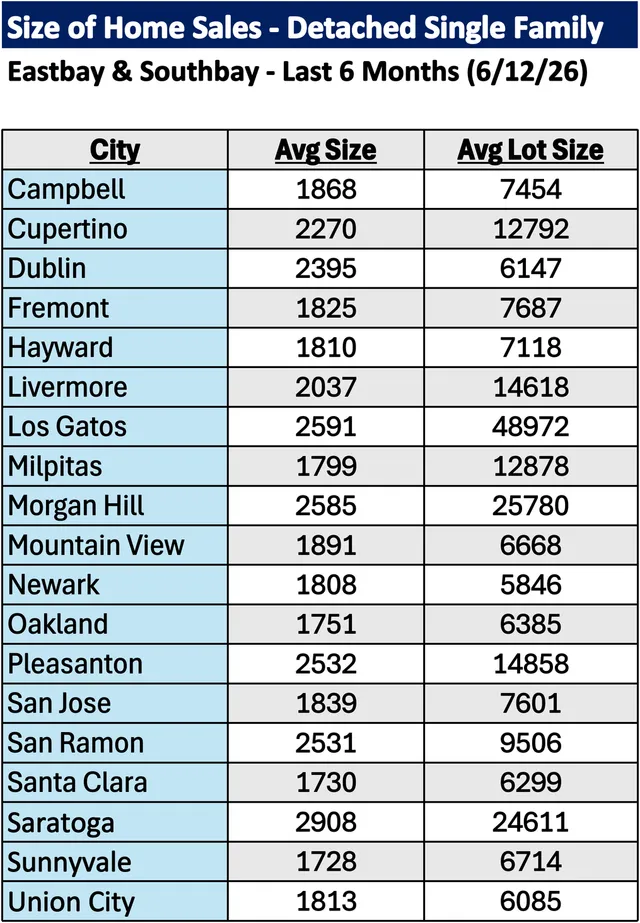
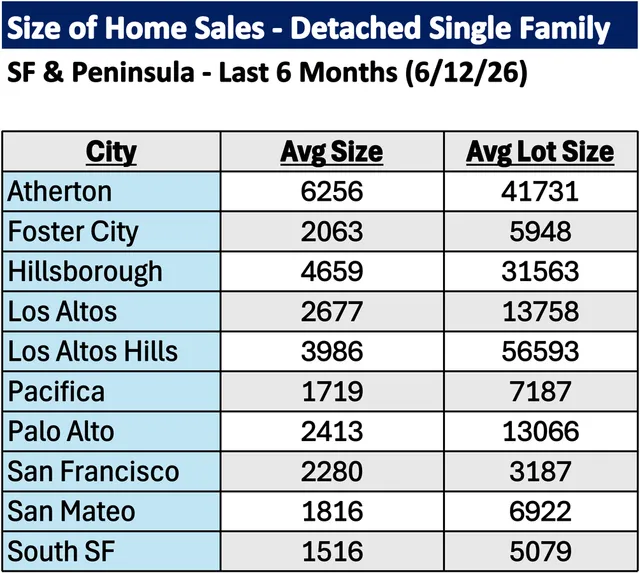
For more information on how these trends might affect your home values and/or the timing of your real estate moves, please reach out anytime. Note if your city is not listed here, a personalized analysis can be created upon request. You can also visit my website (www.JoshUy.com) which has additional resources for home buyers and home sellers. This sales data was provided by the Bayeast MLS Association and collected through 6/12/26. Data deemed reliable but not guaranteed and is subject to revision.